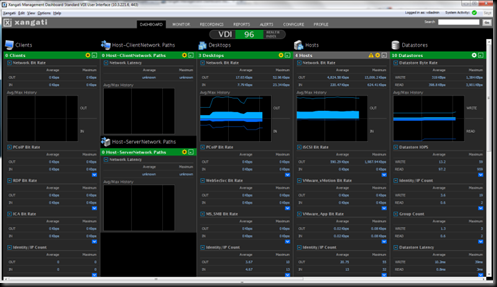
Ok so I’ll take my tongue out of my cheek – I have never heard Xangati’s summer refresh of their performance monitoring dashboard called by its Three Letter Acronym (TLA) before, but I was lucky enough to be given a preview of the Xangati Management Dashboard (XMD) and to be shown some of the new ways in which it can gather information and metrics relevant to a Virtualised Desktop deployment.
When I first came across the product about 12 months ago, it’s main strength was in the networking information it could surface to a VI admin – by use of small appliance VM’s sitting on a promiscuous port group on a Virtual switch it was able to analyse net flow data going in and out of a host – when this was aligned with metrics coming form Virtual centre. The products “TiVo” like recording interface was able to capture what was happening to an infrastructure either side of an incident , be it a predefined threshold , or an automatically derived one – where a workload was suitably predictable for a given length of time , the application was able to create profiles for a number of metrics and record behavior outside that particular profile. As with other products that attempt to do dynamic thresholding , the problem comes in the form of an environment which is not subject to a predictable workload where is possible to miss an alert while the software is still “learning” – it also assumes that you have a good baseline to start with. If you have a legacy issue that becomes incorporated into that profile , then it can be difficult to troubleshoot. To this extent I’m glad that more traditional static thresholds are still able to be put in place. When monitoring environments with vSphere version 5 , there is no more requirement for the network flow appliances – the netflow data is provided directly to the main XDM appliance via a vCenter API. With a Single API connection , the application is focussed on much more than just the network data – allowing a VMware admin to see a wide view of the infrastructure from the Windows process to the VMware Datastore.
What interested me about the briefing was the level of attention being paid to VDI – I think Xangati is quite unique in terms of their VDI Monitoring dashboard and the latest release reinforces that. In addition to metrics that you would expect around a given virtual machine in terms of its resource consumption , Xangati have partnered with the developers of the PCoIP protocol , Terradici in order to be able to provide enhanced metrics at the protocol layer of a VDI connection. This offers a welcome alternative to the current method of having to utilise log analysers like Splunk.
VDI users are in my opinion much more sensitive to temporary performance glitches than consumers of a hosted web service. If a website is a little slow for a few seconds , people might look at their network connection or any number of alternative issues , but for a VDI consumer , that desktop is their “world” and would affect every application they use. Thus when it runs poorly they are much more liable to escalate than the aforementioned web service consumers. Use of the XMD within a VDI environment allows an administrator to trouble shoot those kinds of issues ( such as storage latency or badly configured AV policy causing excessive IO ) by examining the interaction between all of the components of the VDI infrastructure , even if the problem occurred beyond the rollup frequency of a more conventional monitoring product. This what Xangati views as one of its strengths , while I don’t think it is a product I would use for day to day monitoring of an environment – there is a lot of data onscreen and without profiles or adequate threshold tuning it would require more interaction than most “wallboard” monitoring solutions, I can see if being deployed as a tool for deeper troubleshooting. There is a facility which would allow an end user to trigger a “recording” of the relevant metrics to their desktop while they are experiencing a problem ( although if the problem is intermittent network connectivity , this could prove interesting ! )
As a tool for monitoring VDI environments it certainly has some traction , notably being used to monitor the lab environments for last years and this years VMworld cloud based lab setups , as well as some good sized enterprise customers. With this success I’m a little surprised at the last part of the launch, “No Brainer” pricing… In a market where prices seem to be on a more upward trend , Xangati have applied a substantial discount to theirs – with pricing for the VDI dashboard starting at $10 per desktop for up to 1000 desktops. I’m told there is an additional fee for environments larger than that. I’m no analyst but I’d love to explore the rationale behind this.. Was the product seen as too expensive ( although as with many things , the list price and the price a keen customer pays can often be pretty different – is this an attempt to make software pricing a little more “no nonsense ? “ I guess time will tell !
For more information on the XMD and to download a free version of the new product , good for a single host , check out http://Xangati.com


