Archive for August, 2010


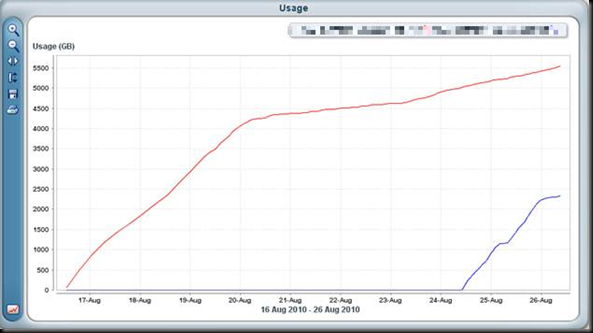
Doing a few daily checks today and wanted to compare utilisation between the 2 Veeam backup proxies that are now running in production. After bribe of a cup of coffee to a colleague on the storage team I got a nice load of graphs from our back end storage showing the utilisation of the LUN’s designated for the backup storage. You can quite clearly see the when the full backups finish and the incremental ones start. This combined with the built in compression and inline de-duplication that Veeam Backup uses allows me to make good use of that backup space – only consuming 5.5 TB for nearly 10 days of backup for 20TBs of machines. To use a marketing calculation I’ve seen presented by a well known vendor of de-duplication hardware  that’s (20*10)/5.5 = 40x compression. Not bad for a software product.

image

footnote : the blue trace is the 2nd backup proxy – its just finished its full backups , so hopefully that plateau has just been hit.

There is no shortage of information online and across social media about the Veeam products. They market them well and have a good following because they are pretty reliable , cost-effective and well, really quite good 🙂

What there seems to be a lack of is some good case study in the public domain about usage outside a demo lab – we’ve all seem the Demos where it takes a backup in the blink of an eye, restores it then makes you a cup of tea before finding your favourite channel on sky and recording that film you where about to miss ( dramatisation : may not actually make you tea! )

I’ve recently been through a project to implement the Veeam backup product in our non-production environment. To give you a little bit of background, this has recently been migrated over the Atlantic from a datacenter where Netbackup was king. Moving to a “fresh” environment , previously only used for disaster recovery allowed us to pick a new product that would offer the level of protection we required for the most effective use of resources.

Onto the workload – the workload consists of over 400 VM’s across 2 clusters, both attached to fibre channel storage. Source data size is currently over 40Tb , with expectations to grow beyond 50 in the not too distant future. being a pre-production environment the virtual machines themselves run a lot of application & sql servers in addition to 2 complete AD forests with separate resource domains.

While at the proof of concept stage I had zero budget to spend on hardware so evaluated the product in 2 different ways , on an elderly physical server I’d scrounged & as a Virtual Machine running in appliance mode. This enabled me to see what pitfalls I’d come across as I progressed.

The brief for protection was to be able to capture a minimum of 14 days of backups , with no long term retention required ( these environments are often rebuilt so long term storage wasn’t a consideration at this stage )

After building the PoC machines and installing the application ( as many other people have said , this is very straight forward ) – I was able to start taking backups pretty much straight away on the Virtual Appliance. The Physical backup proxy needed some configuration at the SAN end in order to be able to suitably zone the HBA to the same LUN’s as presented to the Source cluster – with a mix of storage vendors this was … interesting )Its also vital that you open up a diskpart prompt and prevent auto mounting of volumes – automount disable and automount scrub are the commands to use, followed by a reboot.

Wanting to get backups up and running as soon as possible I simply created a single job per server – at the time this was around 100Vm’s per proxy , by using the hosts themselves as the selection criteria for the job. This would ensure a “fail-safe” backup. If someone deployed a virtual machine into that cluster , then it would be backed up no matter what. With a relatively low count of source machines per proxy , this wasn’t an issue as I was just about to get the backups complete inside a 24 hours window , after the initial pain of first backup.

The proof of concept machines churned away through a couple of months ( with the help of an extended trial licence kindly provided by our account team at Veeam ) but as more and more machines were migrated into the environment , the time taken for backups got longer and longer , until the jobs where taking an unreasonable time to complete ( in excess of 72 hours). It was time for some performance tuning.

Some of the items on the tune list were within my power , some were not. For a start we had no concurrency in the backup streams , so even though I’d put up a pretty powerful virtual machine as an appliance , we were not seeing the benefit. This would have to be addressed by a fundamental change in job design , which I will come to later on. On the physical proxy side , the hardware I’d been able to scrounge was a pretty elderly DL380G3 , with a couple of CPU’s – also not up to running multiple jobs. Due to some logistics issues, we also had a less than ideal fabric configuration which was affecting data transfer rates between the source and target – this would have to wait for the storage team to fix.

I knew that for the application to move to the production stage, I’d have to make some significant changes. I started by changing my initial plan to deploy multiple proxies as virtual appliances as at the time there seemed to be a few teething problems with the virtual appliance letting go of allocated disks & committing the snapshots taken during backup. This meant that I’d had to keep a very close eye on snapshot creation & manually release any volumes each morning, not a task that would be acceptable in a production system. I’m happy to say just before I stopped using the virtual appliance , an update from Veeam to version 4.1.2 resolved these issues, which may have been a part of how the hotadd functionality is implemented within Vmware. A virtual appliance still remains part of the final design , but more as an emergency box. The design went to using 2 new blades as backup proxies – the power of the BL460G6 would be more than enough to allow us to run many overlapping jobs.

From conversations with our systems engineer at Veeam & a little research on their forums, It seems that you don’t really want to run backup jobs with more than about 2TB of source machines in place. For the first cluster , that meant that the new servers would need 11 jobs to backup all the source VM’s. The division of these jobs was a bit of a concern initially and required a little housekeeping within the virtual infrastructure. VM’s were organised by application group ( clearly defined in our internal CMDB )  into subfolders underneath the SLA. I then created the jobs , selecting folder in alphabetical order until the load was around 2Tb, where I knew an application expected significant growth I left space in the job.If we had organised our vm’s by Application using something like Business View , it would have been nice to have that business view integrate with the application, even nicer if it woudl have auto provisioned the jobs based on the folders.  By using the vm folders as part of the job selection the jobs will adjust to new VM’s providing they are put into the folders of course! I coudl have done this with resource pools or vApps , but as we operate a flat landscape from a resource pool point of view , this wasn’t needed.

Due to being new job setups ( on new boxes ) the pain of building a full backup had to be done. In my own impatience I set too many off at once and made a bad discovery. What I had been told were nice new blades were in fact hand-me-downs with only a pair of dual core CPU’s. Trying to run 8 concurrent jobs made it sweat a bit, but after a couple of days where where all done. The jobs now fire off at 2 hour intervals during the day and take 2-4 hours to complete. This eases up the load on the host , completes the entire backup within a 24 hour window & gives a restore window for each job , which was previously not possible. I’ve recently repeated the process with the second server and cluster , which is just about to finish off its full backups but I think its safe to say its a pretty busy little setup!

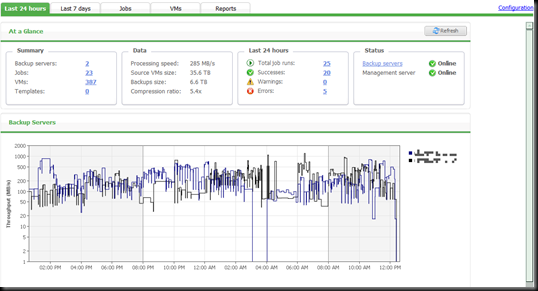
image

The trace with the black line is the server building up its full backups as we speak , so the counters are a little down – there are a good few more VM’s to add ! I’m looking forward to upgrading this particular setup to v5 and putting a little vPower into the environment 🙂

What I learned about my Veeam Deployment.

  • Split your jobs up into bite sized chunks – you’ll complete your backups better and be able to restore when you want.
  • Its not always the size of the dataset that dictates the time taken to backup. The number of VM’s will have a significant impact due to the overhead of cbt analysis and the snapshot management side.
  • When you deploy more than one proxy – make sure you deploy Enterprise manager – not only does it produce some easy to view reports , but provides a very handy way for application teams to see if a VM is being backed up or not.
  • When building your full backup set – don’t kick the jobs off all at once
  • If you do plan on concurrent backup streams then make sure you have plenty of cores available.

image

image

In a series of briefings from VKernel over the last few months we’ve seen upgrades to their core products , and a number of entry point free applications designed to give you taster of the power of the core products.

One of the points that I bought up every time I engaged with the vendor was that there was a fairly low level of integration between the products , and I felt that VKernel was really missing out by not blending these apps together , not only at the front end , but at the back end , as its clear there was a good level of duplication of data between them.

I’ve come to realise over the last 24 months that VKernel is pretty good at listening to its end users and the feed back I got was that an integrated platform was on its way. Wait no more , as its finally arrived.

Introducing the VKernel Capacity Management Suite 2.0

The Product is currently in private beta , but should be available to play with if you are lucky to get to go to VMworld in San Francisco – the rest of us will just have to hope for a beta invite pre GA , or Trial it on release. The CMS combines a number of the core VKernel product lines into a single appliance and claims to give improvements in 3 Keys areas , namely Scalability , Analytics & automation. The Suit integrates Capacity Analyser 5.0 , Optimization Pack 2.0 , Chargeback 2.0 and Inventory 2.0. The features are licensed individually and start at $299 per socket.

By combining the back end database requirements of the Capacity Analyser , & Optimisation Pack and Modeller ( due for roll into the CMS at a later date ) – the load on the vCenter API is considerably reduced. I’ve seem problems caused by too many requests to vCenter at once and will be glad to be able to reduce this where possible.

VKernel seem to have borrowed a page from Veeam’s business view homework and integrated an ability to create a more customised view of your environment , not just the vCenter hierarchy . Group can be organised by business unit , SLA or any particular way you define them. This is particularly handy where you implement a chargeback model as different groups may have different rates of chargeback. Previous incarnations of the VKernel products did allow this to happen , but the grouping were not shared between appliances , which made it a bit of a pointless exercise. With common grouping between each appliance that can contain VM’s from a number of vCenter instances , you are able to really see things through that mythical single pane of glass. The levels of capacity analysis can be varied between groups including implementing a custom vm model at each stage ( Data centre , Cluster , resource group or custom group )

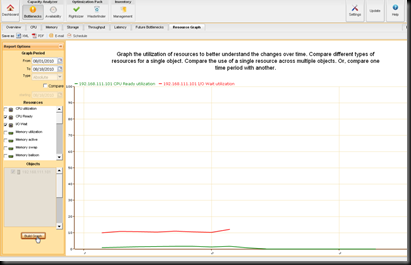
Any capacity management solution is only as good as its analytics and its where VKernel believe they are best in class within the Virtual World. with CMS 2.0 the VKernel have made some key improvements to the main analytics engine , this includes the use of storage throughput data in capacity calculations so that you are not longer just looking at CPU/ RAM / Drive Space when it comes to capacity calculation. Thin provisioning support is also provided, I personally haven’t seen the types of recommendation for this but would like to see recommendations on which VM’s can be safely thin provisioned due to a lo rate of drive space consumption. As previously mentioned , the “model” vm can be tweaked for different groups so you are not limited to a once size fits all recommendation for available capacity. You are also able to graph a number of VM parameters against each other so you can see what has changed over time and how its affected other parameters. An example of this is shown here.

image

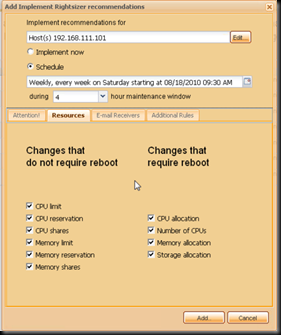
A feature missing from a number of other available solutions is the remediation side. Its all very well and good telling me where I should make the changes to a number of vm configurations , but in a large installation , its going to take me a long time to implement those recommendations. with CMS 2.0 its possible to remediate virtual machines based on the recommendations made ( some changes will require a virtual machine reboot, and these can be scheduled for off peak times ) The remediation screen will look something like below.

image

The notable exception to this is the “storage Allocation” option. I can see this being a tricky one , as it would involve shrinking of the guest drive , which might present a few issues on older windows guests. In the future perhaps an option could be implemented to migrate the VM to being thin provisioned ?

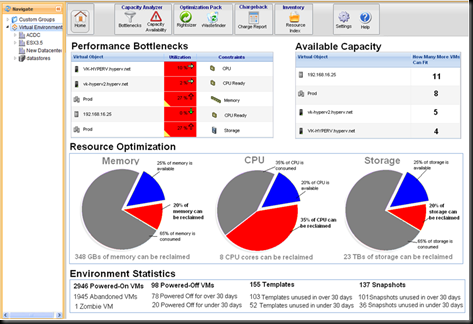
I was able to go through a live demo of a pre beta version of the product and the first thing you notice is the new Dashboard – a lot of work has gone into the redesigned UI and its a welcome improvement !

image

Users of the Optimization pack will find the layout quite familiar , with the Vm tree on the right hand side and the available appliances along the top. The The dashboard gives you a good at a glance view of the environment , before you start to drill down. What is a new features is being able to drill across – selecting a given branch of your environment , be it a traditional VI view or a custom grouping , then moving across the top icons you can click to view Capacity Bottle necks and available capacity , then move to the optimization features and see when in that branch you are not making the most effective use of your resources. As with previous versions of the product , any report you generate can be scheduled & emailed.

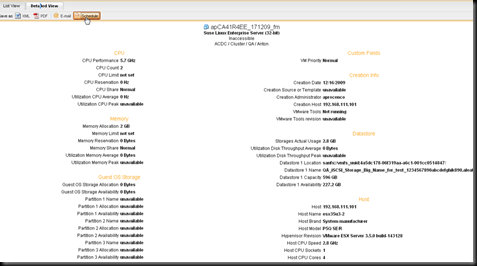
In some ways the unsung hero of the older versions of the optimization pack , the Inventory product has matured to a fully standalone offering. In use , its a great way to get detailed information on your virtual estate. Its essentially an indexed view of all of the virtual machines in your environment that you can organise , sort and export as you wish. In a previous life I used to use inventory to automatically mail summary list of VM’s by application to our financials teams to use in their static chargeback model as is gave a very easy way of showing total resource allocated to a VM ( including a sum of storage allocated ) . I’m sure you could find a number of extra uses – how about generating an XML export that your CMDB could pick up from ? In addition to the tabular information , its also possible to extract some pretty detailed information on a VM as shown below.

image

When CMS 2.0 is released – you’ll be able to grab a trial and see for your self. I’m looking forward to it 🙂

little foot note – speaking of rings , I proposed to my partner on Friday and am happy to report that she said yes ! 🙂

image Looks like Veeam are not the only people running a competition at the moment. Greg Stuart from vDestination.com is running a great giveaway on his site – for the chance to win a smorgasbord of goodies from some of the top vSphere booked signed by the authors , to a complete set of vSphere trainsignal videos ( for a review of the videos ,check out my post here )to some bumper stickers and t-shirts !


To enter the competition , follow the link below.


http://vdestination.com/2010/08/08/win-the-ultimate-vsphere-reference-library-and-more/#contact-form-398

image

This post is a shameless bit of promotion for 3 Parties:

Me: I’m enjoying blogging and get a little warm fuzzy feeling every time I open up Google analytics and see the graph going up 🙂

Veeam: Veeam have launched a free version of one of their leading product lines , and they are keen for people to know it , try and and possibly one day upgrade to the Enterprise version

image

The International Foundation of Red Cross and Red Crescent Societies: Veeam have launched Reporter Free Edition as part of their “Totally Transparent Blogging competition” – The prize for which is not something shiny from apple , EMC or Veeam themselves , but a $1000 charity gift card. As one of the first 15 Entrants I’ve already “won” $25 for the IRFC , but if this post ( and the endless nagging via Twitter , MSN , Forums & Email ) persuades enough people to download the free product then I win, by which I mean the IFRC win !

Right , shameless plugs over and down with , its down to the product that I think you should at least spend 90Mb of your plentiful bandwidth downloading ( for those on a mobile browser, I’ll let you off , but for every other JFVI reader , there is no excuse ! )

ok , really , that’s it with the plugs ! I promise the rest of the post will be nothing but a slice of technical fried gold.

I’ve evaluated a number of free products and plugins for the Virtual Infrastructure , but Veeam Reporter 4.0 seem to be the most polished and for a free product the limitations still leave you with something to add value to your infrastructure. After downloading the install file , you’ll need to find a suitable box to run it on, I used a spare Vm that had been servicing VMware update manager , its reasonably well specced for a Vm but not especially busy so an ideal candidate.

Reporter does require a few more pieces of the puzzle then just the install , so you’ll also need to hand either a SQL box with a little space on it, or the SQL Express Advanced edition , complete with SQL reporting Services 2008 – using SRSS really turbocharges the functionality of the reporting product , especially within a Windows shop who may well have an SRSS instance already – integration of reports generated into a SharePoint instance is also a synch. I initially ran the product without the SRSS integration which while it is a still a powerful tool to generate offline reports of your infrastructure in Excel , Acrobat , Word and Visio formats , you really only get the full functionality from the product by using Reporting Services. You’ll also need .net framework version 3 & IIS with Windows Authentication enabled.

Although you do get some things for nothing , you don’t quite get everything , Veeam have a document up , highlighting the difference between the free & paid versions here.

http://www.veeam.com/veeam_reporter_free_edition_wn.pdf

To summarise , you only get 24 hours of change management reporting , slightly limited offline reports & no Powershell or Capacity Management functionality , but should you decide you can’t live without the features , they are only a licence key away!

Access to the application is via a web front end , this allows you to configure data collection jobs so that you control the load against vCenter , it also allows you to configure some regular reporting jobs. Integration with Veeam’s FREE  Business View product is also built in so that you can look at your environment from more than just the view offered by vCenter.

Data Collection Screen

image

Once you have some data stored , you can move to the workspace tab and generate some reports with it. The left hand side shows your current tree view ( be it infrastructure or business view ) and the right had side has a series of drop downs to help you build your report. In the free version you are limited to the pre-canned reports provided by Veeam , however should you purchase the licensed version , it is possible to create custom reports based on the data collected.

Report Workspace Screen

image

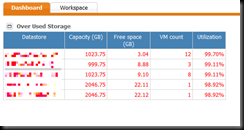
You can add a key report to the Front screen dashboard , it’ll be updated as soon as data collection is finished , though you are limited to just the 1 Widget in the free version. I chose datastores over capacity.

Dashboard
image

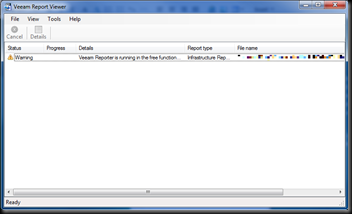
one of the main reason the free version of reporter interested me as was a documentation tool. I was recently asked to document a large portion of my virtual infrastructure , and felt that being able to export the maps from virtual center into Visio in a format I could modify would have made my life a lot easier. In Reporter , this is done using the offline report pack. You’ll need to be on a workstation with the office tools you need installed , and also install the Veeam Report viewer , of which a handy link is provided on the offline reporting workspace.

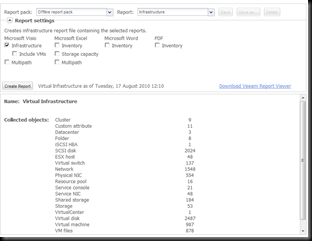
Build your report in a similar way to the SSRS reports , but when you run it , you’ll be able to download the complete report file , which contains all the elements you selected.

Offline Reporting Workspace
image

Report Viewer Interface

image

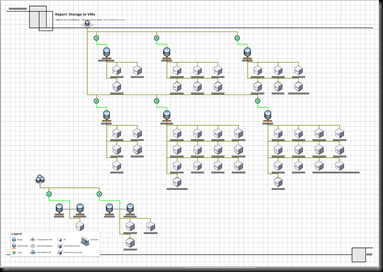
in the example above I’ve just gone for a simple infrastructure report of a 4 node cluster. This opened up a couple of Visio drawings. One of which I’ve shown below – a report of Storage allocated to VM’s
image

And its not just a pretty picture either , each of the objects has a full set of the data attributes for that object from annotation to UUID – I lost count at 100 of them.

For smaller infrastructures , Veeam bundle the reporting product along with Monitor and their excellent backup and replication software as part of the Veeam Essentials Package.

I’ll finish off now with another shameless plug. This is a great free product for putting some initial documentation together along with a great set of reports that you’ll want to check every day. So what are you waiting for , please click the link below, download the product and help me donate $1000 to a worthy cause.

http://www.veeam.com/reporter-free-promo/jfvi.co.uk

WordPress Tags: Manage,environment,Help,Veeam,Reporter,Edition,promotion,Parties,Google,graph,version,product,Enterprise,International,Foundation,Cross,Crescent,Societies,Free,Transparent,competition,gift,card,Entrants,IRFC,Twitter,Forums,Email,IFRC,JFVI,reader,products,Virtual,Infrastructure,limitations,VMware,manager,candidate,Services,SRSS,Windows,instance,integration,SharePoint,tool,Excel,Acrobat,Word,Visio,framework,Authentication,Although,difference,versions,hours,management,Powershell,data,collection,jobs,View,Once,workspace,tree,series,custom,Report,Front,dashboard,Widget,documentation,life,workstation,office,tools,viewer,Build,SSRS,Offline,Interface,example,node,drawings,Storage,annotation,UUID,infrastructures,Monitor,replication,Essentials,Package,promo,vCenter

image

Just when you thought it was safe to release something without prefixing with a “v” , Veeam have announced the name of collection of new features in the next version of their flagship backup & replication product.

Today’s webcast by Doug Hazleman gave a quick overview of Veeam backups history of firsts, including Instant file level recovery, Inline dedupe and ESXi replication support . Version 5 brings a whole new set , including 3 patent pending technologies

– Run VM directly form Backup file

– U-AIR ( universal application item recovery)

– Recovery Verification


Looking at the recovery verification piece , Veeam commissioned a survey ( results to be published in September )  on backup verification and found the following key points :

– Only 2% of backups are tested for recoverability

– Average time to test backups was 13 hours

– Median cost of failed backups in excess of $400,000 per year.

We’d all love be to able to say that all of our backups will work 100% of the time and having that piece of mind would most certainly prevent the sinking feeling of hours spent to retrieve a tape containing a failed backup , which is about as much use as a chocolate teapot. With Surebackup technology , every single VM level backup you take can be started up and verified that it’ll boot.


The core feature of all of the patents is the ability to mount a virtual machine directly form a series of backup files via an NFS datastore directly to a host. That machine can be booted up like a “space-save” tyre. It’ll work but don’t expect it to be all that fast. The recovered VM can then be storage vmotioned out of the recovery datastore back into production , should a more permanent restore be required. It would also be possible to use the replication functionality of Backup  & Replication ( clue’s in the title folks ! ) to replicate that VM to another host , although there would likely be a brief outage during cutover . The instant restore process also extends to file level restores , covering 15 different file systems without the use of VMplayer. Those running a windows shop are extra pampered by an instant indexing service across all backups.


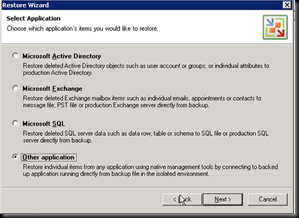
U-AIR is all about doing an instant recovery of a VM or set of VM’s that comprise an application , booting them up inside a ring fenced environment the pulling an item out of that backup. Veeam claim to support “any” virtualised application for this , although personally I would add the caveat that the application needs to also have all of its dependencies virtualised – this would include any authentication piece an application uses. If you do have applications that meet those requirements however , you are in for a treat. Application item recover can be user led ( via outlook web access for example for exchange ) or admin led via a series of wizards for AD , Exchange and SQL. In addition to application item level restores , the U-AIR functionality can be used to generate an on-demand snapshots of an application , not too dissimilar to one provided by VMware’s own lab manager. This would be ideal for patch testing in an application where it may not be possible to run a full set of lifecycle environments.


After the brief slide deck , Doug moved onto a live demo of the system which looks at first glance pretty much like version 4.x but with the addition of a couple of extra tree items.

The surebackup node is where you define an application group , this can be defined within the product , or can pull in data from existing vApps configured in your infrastructure. Once a datastore is configured to hold any changes to the VM’s during verification, the proxy appliance is set up to allow connectivity between the application and the outside world. this builds a resource pool and vswitch on the host –it would be interesting to see if this will talk to a distributed switch to allow surebackup to run over multiple hosts. You can also see the NFS datastore mounted by the Veeam server. The surebackup job is linked to the application group and its related backup job and is separate to that backup. It can be set to run after the backup completes. The job can be configured to boot all the VM’s in the application group up then run a series of tests on them , namely boot , ping or custom scripts.


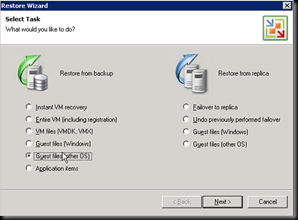
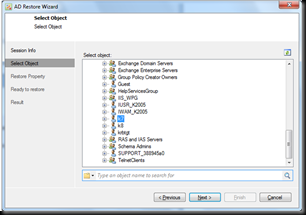
The Restore node in the tree is also a change from v4 – offering a nice looking wizard that I was able to get a few cheeky screen grabs of.

image

image

  image

When restoring a virtual machine , it is possible to specify a delta datastore to hold updates to that VM, so that the Veeam NFS store is only used for reads , but that would prevent you from doing a storage vmotion. Still , its there as an option if you had to get a machine up and running a bit faster than limp home in a hurry. The demo showed that the VM was mounted pretty much instantly , but didn’t actually boot it up.I’d like to have seen the difference in running speed between a VM and one mounted through the backup.


As well as changes to the core product , there are also changes to Enterprise manager , a web based service that allows a Veeam administrator to track and report on a number of Veeam backup servers. As a current user of the product I’m looking forward to a more in depth review of EM , and would love to see it move from a rollup reporting server to a central admin console for the product. What does look to be news is that EM is the central point for searches over those indexed files within a windows backup , allowing you to search your entire environment for files form a single point. I had concerns as to how this might impact the performance of the EM server , which is a pretty small VM in my environment , but was assured that all the indexing goes on at the backup server level. The Lab manager like functionality is also enhanced with EM allowing servers to be temporarily restored from backup , into that ring fenced environment and being removed after a certain period of time.


After the live demo , there was a brief Q&A session – in which the different SKU’s where covered ( there will be an Enterprise & Standard edition , with Standard missing a few features – it wasn’t said which ones. ) and a quick point on the requirement for trusts to be place for U-AIR to work in a multi domain environment , not a huge issue for most , but could be if you run multi tenant / forest.


If you’d like to view the whole webcast , I believe it will be available shortly at http://www.veeam.com/go/vPower-webinar

I was fortunate enough to have the opportunity of a face to face meeting with Doug this week, He happened to be passing through the UK on the return leg of his travels to see amongst others , the development team in Moscow.

While vendor meetings are a reasonably frequent part of my worklife , they are not usually with the CEO , but its clear that then it comes to Vkernel they all share the same vision of flag ship product offering the best in class for Capacity Analysis.

After a brief bio.. (He’s only a recent addition to the Vkernel team , but as former CEO of Onaro and experience at Motive & Tivoli , he no stranger to the arena ) We talked about how Vkernel got where it is , and what the current offerings are, both free and licensed.

Then we got to the interesting stuff – where Vkernel is going. One of the things I’ve always fed back not only as a blogger but as an end user is a call for tighter integration between the product lines. In a world where de-duplication is very much a buzzword , there is plenty of scope within the product range for integration not only at the front end in terms of user interface , but at the back end datasets. The next release major release ( as yet unnamed ) from Vkernel will seek to address that and move all of the task under that single pane of glass in a single appliance with a single database. I know this has been in the pipeline for some time and I’m looking forward to getting my hands on it. The other main feature Doug hinted towards was about getting data out of the products. While they have their own transports for pulling data out ( scheduled reports in  pdf or xml) there currently isn’t any way that this could be done programmatically – who knows what form this API could take but it any way of exposing the results of the analysis to the rest of the environment has got to be “a good thing”

Moving away from the technical to the strategic side we briefly touched on some of current news of VMware targeting its own partners and releasing a competing product in many sectors of the management eco system. Far from reducing revenue , Doug believes the reverse has occurred as awareness of the need for capacity management is raised people are more likely to “bake off” a number of products from all the main vendors and choose the one they like best. Looking to the future we spoke around the idea of more intelligent modelling using metrics derived from what a given environment can provide, to give an accurate benchmark of the typical VM. This has a high value at the Architecture stage of a project , where you can clearly see if your environment meets the requirements of the vendor , not only in CPU/ Ram count , but network and IO performance.

Watch this space for more news on upcoming releases from Vkernel.