In a series of briefings from VKernel over the last few months we’ve seen upgrades to their core products , and a number of entry point free applications designed to give you taster of the power of the core products.
One of the points that I bought up every time I engaged with the vendor was that there was a fairly low level of integration between the products , and I felt that VKernel was really missing out by not blending these apps together , not only at the front end , but at the back end , as its clear there was a good level of duplication of data between them.
I’ve come to realise over the last 24 months that VKernel is pretty good at listening to its end users and the feed back I got was that an integrated platform was on its way. Wait no more , as its finally arrived.
Introducing the VKernel Capacity Management Suite 2.0
The Product is currently in private beta , but should be available to play with if you are lucky to get to go to VMworld in San Francisco – the rest of us will just have to hope for a beta invite pre GA , or Trial it on release. The CMS combines a number of the core VKernel product lines into a single appliance and claims to give improvements in 3 Keys areas , namely Scalability , Analytics & automation. The Suit integrates Capacity Analyser 5.0 , Optimization Pack 2.0 , Chargeback 2.0 and Inventory 2.0. The features are licensed individually and start at $299 per socket.
By combining the back end database requirements of the Capacity Analyser , & Optimisation Pack and Modeller ( due for roll into the CMS at a later date ) – the load on the vCenter API is considerably reduced. I’ve seem problems caused by too many requests to vCenter at once and will be glad to be able to reduce this where possible.
VKernel seem to have borrowed a page from Veeam’s business view homework and integrated an ability to create a more customised view of your environment , not just the vCenter hierarchy . Group can be organised by business unit , SLA or any particular way you define them. This is particularly handy where you implement a chargeback model as different groups may have different rates of chargeback. Previous incarnations of the VKernel products did allow this to happen , but the grouping were not shared between appliances , which made it a bit of a pointless exercise. With common grouping between each appliance that can contain VM’s from a number of vCenter instances , you are able to really see things through that mythical single pane of glass. The levels of capacity analysis can be varied between groups including implementing a custom vm model at each stage ( Data centre , Cluster , resource group or custom group )
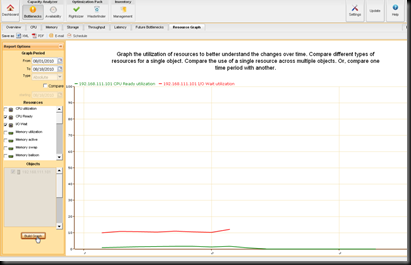
Any capacity management solution is only as good as its analytics and its where VKernel believe they are best in class within the Virtual World. with CMS 2.0 the VKernel have made some key improvements to the main analytics engine , this includes the use of storage throughput data in capacity calculations so that you are not longer just looking at CPU/ RAM / Drive Space when it comes to capacity calculation. Thin provisioning support is also provided, I personally haven’t seen the types of recommendation for this but would like to see recommendations on which VM’s can be safely thin provisioned due to a lo rate of drive space consumption. As previously mentioned , the “model” vm can be tweaked for different groups so you are not limited to a once size fits all recommendation for available capacity. You are also able to graph a number of VM parameters against each other so you can see what has changed over time and how its affected other parameters. An example of this is shown here.
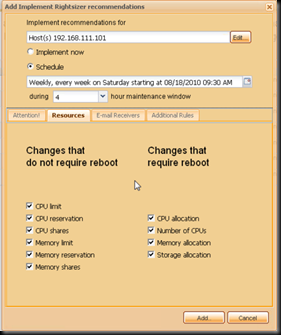
A feature missing from a number of other available solutions is the remediation side. Its all very well and good telling me where I should make the changes to a number of vm configurations , but in a large installation , its going to take me a long time to implement those recommendations. with CMS 2.0 its possible to remediate virtual machines based on the recommendations made ( some changes will require a virtual machine reboot, and these can be scheduled for off peak times ) The remediation screen will look something like below.
The notable exception to this is the “storage Allocation” option. I can see this being a tricky one , as it would involve shrinking of the guest drive , which might present a few issues on older windows guests. In the future perhaps an option could be implemented to migrate the VM to being thin provisioned ?
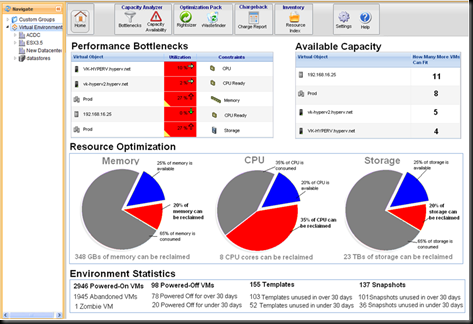
I was able to go through a live demo of a pre beta version of the product and the first thing you notice is the new Dashboard – a lot of work has gone into the redesigned UI and its a welcome improvement !
Users of the Optimization pack will find the layout quite familiar , with the Vm tree on the right hand side and the available appliances along the top. The The dashboard gives you a good at a glance view of the environment , before you start to drill down. What is a new features is being able to drill across – selecting a given branch of your environment , be it a traditional VI view or a custom grouping , then moving across the top icons you can click to view Capacity Bottle necks and available capacity , then move to the optimization features and see when in that branch you are not making the most effective use of your resources. As with previous versions of the product , any report you generate can be scheduled & emailed.
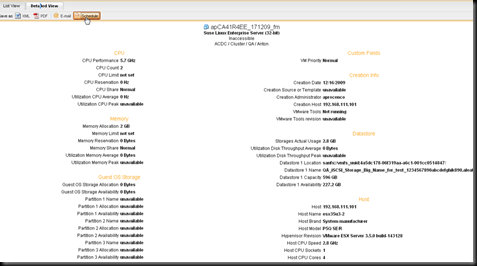
In some ways the unsung hero of the older versions of the optimization pack , the Inventory product has matured to a fully standalone offering. In use , its a great way to get detailed information on your virtual estate. Its essentially an indexed view of all of the virtual machines in your environment that you can organise , sort and export as you wish. In a previous life I used to use inventory to automatically mail summary list of VM’s by application to our financials teams to use in their static chargeback model as is gave a very easy way of showing total resource allocated to a VM ( including a sum of storage allocated ) . I’m sure you could find a number of extra uses – how about generating an XML export that your CMDB could pick up from ? In addition to the tabular information , its also possible to extract some pretty detailed information on a VM as shown below.
When CMS 2.0 is released – you’ll be able to grab a trial and see for your self. I’m looking forward to it 🙂
little foot note – speaking of rings , I proposed to my partner on Friday and am happy to report that she said yes ! 🙂


 LinkedIn
 Twitter