Archive for December, 2010


image

So this possibly isn’t the first 2010 roundup you’ve read during this festive season , but I think all of my fellow bloggers have had a wide enough range of experiences and posts throughout the year to make theirs a literary snowflake as it were !


So what did 2010 deliver ? For the industry we saw some great progress in products, especially around the management piece , with ground breaking releases from Veeam and VKernel to name but two. Towards the end of the year, the “C” word became even more common with everyone doing something for “the cloud” – how much of it will still be relevant in 2011 is still up for debate!


2010 was also a very busy year for me – not only did $dayjob keep me pretty busy , and offer the chance of a shift from operations into a more design focussed role , but I’ve become an active member of the Virtualisation Community through my local user group , Twitter and at the beginning of the year , starting the blog.  Its been a very successful 1st year of blogging for me , and I hope I can keep the momentum up in 2011.


One of the highlights for the year would have to be my time spent in Copenhagen at VMworld Europe 2010 – meeting up with some great people in the community and getting the chance to ask more awkward questions to vendors! From the Large event down to the small event , I was extremely proud to have been invited to the Gestalt IT Tech Field Day in San Jose – I’ve never had such an intense week of total immersion in technology in my life, perhaps I’ll be able to repeat the experience in 2011 and get face to face with the cutting edge of technology !


And finally to all the JFVI readers, thanks for taking the time to check the blog out; I hope you’ve found what I’ve said useful – as ever if there is anything you’d like to know more or have any feedback then mail me at chris@jfvi.co.uk or drop me a line @chrisdearden on twitter !


image

Yesterday, VKernel released a set of reports based on data they have been collecting via their free tools. Using data from over 500,000 Virtual Machines they’ve shown us some data we knew may well have been the case , but it nice to have it confirmed that "everyone else" is doing it as well.


You’ll have noticed in the EULA when you install Capacity View that you agree to send a little bit of data back to VKernel about your environment. Now this data is cleansed ( before being sent back ) but has been used as a basis of the report. I would be lying if I’d said this didn’t concern be at all , but I can think of a few people that might have had a bit of a 5p/10p moment knowingly sending data about what may be their production environment that they didn’t specifically opt-in to. It would be nice to be notified a little better – especially as we can now see that data isn’t being used for evil!

The Data from Hosts , VM’s , Clusters , Resource Pools , Storage ( both allocated & attached ) , Memory ( allocated & available), CPU ( allocated & available ) , Number of powered on / of VM’s , counts of Core / Socket & vCPU , indicators of VM’s with performance issues & underutilised VM’s.

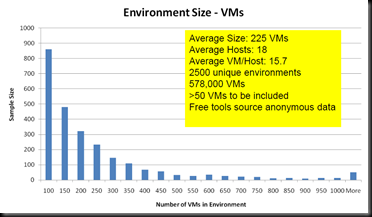
One of the nice summary graphs from the report just shows the size of environment.

image

Looking at the averages used , it would seem many of the environments seem to be hosting around the 225VM count. Now as the free system would only connect to a single VC at a time you could further qualify this as 225 VM’s per Virtual Center.

The "NATO Issue" Host has 2.4 sockets , and 3.6 cores per socket, each running at 2.6GHz. Its hooked up to about 1.8Tb of storage and has 50Gb of RAM. It enjoys long walks and would like to work with children….. got a bit side-tracked there 🙂 Of course looking at pure averages is nothing without looking at the distribution around it , but the numbers shown would seem to fit with a typical half height blade or 2u rackmount host.

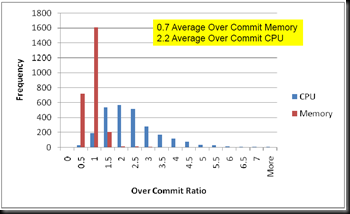
We are still only fitting a mean of just over 2 vCPu / Core – a value that seems not to have changed over the years , however the increased core count has driven the VM/Host count up.


image


If you look at the blue bars in the able chart , representing the distribution of overcommit ratio, you’ll see that CPU Overcommit has quite a "long tail" , while the mean value of 2.2 is quite low , there are still a significant frequency of high vm/core deployments. These sites with a high consolidation ratio could well be for things like VDI , where the CPU overcommit ratio is often considerably higher.

Memory is a different story , though I’d like to perhaps look at it on a slightly different scale to see into the precise distribution. Many organisations are still not happy overcommitting memory and getting value out of technologies like transparent page sharing. this can be due to a number of reasons , e.g.. VM Cost model simplified around a premise of 0% overcommit or in some cases good old fashioned paranoia masked as conservatism. That said , looking at utilisation , RAM is the limiting resource for the majority of hosts , this is partially due to the very high costs of ultra density memory sticks ( there is currently not a linear price point going from 1-2-4-8-16GB sticks ) This may well change with some of the newer servers that simply have so many RAM slots that it is possible to push CPU back to the limiting resource , but personally I like having spare RAM slots on board. If I can hit the sweet spot on price / performance and still have space to expand, I’ll be a very happy camper.

I discussed this point with Bryan Semple from VKernel & it was his thought that by driving that number of VM’s / Host up that the cash saved on power & licensing would cover the higher cost of the memory. I’d love to hear what the JFVI readers think ?

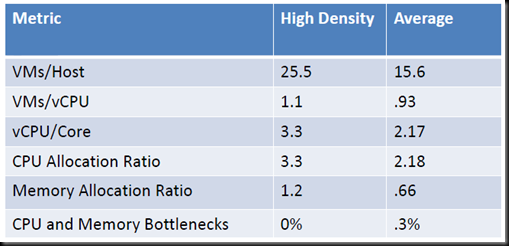
Bryan did a little bit of extra digging from the data and started to look at the high density environments that he had data for. Taking the total number of 2563 environments running over 50 Machines and looking for those that were overcommitting on both RAM & CPU without any indicated performance issues only left us with 95 environments, which seems a touch low , but again within my own environment I almost certainly have clusters that meet those criteria , but possibly not across the board. Within those "High Density Environments" the averages do go up by a fair bit. Leading to up to a 50% saving in costs per VM.


image

I think this is a great set of data to finish off the year with – Most of the data really cements those rules of thumb that so many VI admins tend to take for granted ( which came first , the rule of thumb or the data based on that rule though ? ). What will be even better is next year , assuming VKernel can collect an equally good set of data , and to see if we are able to change any of those key factors (  like VM’s per core ) up.


If you’d like to grab a copy of the VMI Report then its available here .

Centrix Software [LOGO]

I was invited to a call with Rob Tribe from Centrix software last week – following advice from Marketing Guru & London VMUG ring-mistress Jane Rimmer for vendors to get in touch with bloggers – fine advice if you ask me 🙂

I was aware of the existence of Centrix , having seen their booth at VMWorld Europe, but sorry to say I didn’t get a chance to speak to them there , so aside from a brief look at their site , it was something new.

Starting off with a brief look at how the company came to be, which was that it grew from a number of VMware staff who recognised the challenges from taking the same approach to a VDI implementation as a server consolidation project. When an application is installed on a server , there is a fairly good chance that its going to be used. When you have a VDI image with *every* application that’s been put into the requirement specification for that desktop golden image , its going to a) get quite bloated b) require some considerable licensing c) possibly not get all that heavily utilised.


Knowing what is current deployed in your environment is not a new concept by any means. There are armfuls of packages available to collect an inventory from your clients , ranging from the free to the costly and over many different platforms. To get the best from an inventory , many of these applications will deploy an agent to the endpoint in question.


Centrix can deploy its own agent , or take a feed from your existing systems management package and apply some nifty analytics to it in order to give you a more accurate picture of the environment. Currently the key metric in this would be executable start and stop times. This of course will give you the best kind of data when your environment is rich in fat clients or installed software and will give you a true meter of not only total usage , but at what times of day those products are used, thus enabling you to build up a map of utilisation across your estate.


This kind of information would be of great help when planning your VDI environment. Not only are you going to be able to know about the concurrency of the current landscape , but which applications are most frequently used ? Planning which applications should be a core part of your master images and which ones can be deployed via an application virtualisation layer would be made a lot smoother.


Having given an overview of the product, I was looking forward to seeing a bit more under the hood as to how this “workspace intelligence” was achieved.


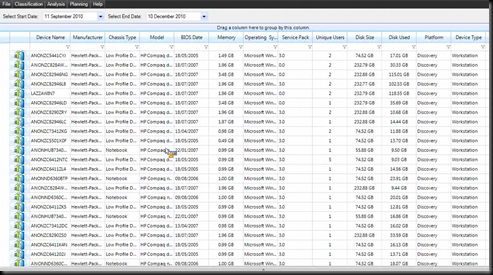
Rob started with the Raw data as shown below – this isn’t anything massively new to write home about , but its interesting to know that the BIOS date of a physical machine is considered a reasonable metric for the age of the deployment , given few machines would have a bios upgrade after they have been deployed to a user.
 

12b2071d-f451-4436-8579-92a87bd0ddd3


The unique users field is also an indication of boxes that have not been logged into during a given monitoring period. This data would be of less importance for servers , after all if a server has remained functional without anyone having to log into it , then its defiantly a good thing ! An unused workstation could be put onto a watch list of systems to decommission perhaps ?

For Each device you can drill down to further information , picking up installed hardware and other common metrics.
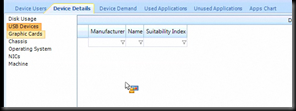
 

4e406325-4067-4375-8c3a-9b4bacd99ffe


So that’s the raw data , how do you go about presenting it ? The example graph below shoes the numbers of applications a given workstation is running over the capture period.


72301da3-596d-4149-a117-a5b98d6f2bf0

We can look at this data in a number of ways to help build up our application “map” . For example , looking at some metric of MS Office utilisation…
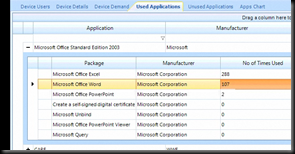
 

eef6a647-79a6-4c05-a55c-e2626bb70e0e

Based on the above data , would you deploy PowerPoint to your VDI base image ? The number of times an application is opened doesn’t give you much of a picture of how heavy hitting that application is. For this metric , Centrix have elected to pick Avg CPU time ( rather than % utilisation – given the heterogeneous nature of CPU across the estate )


58213f77-7151-432d-843f-894211619cd8


In addition to looking at the software utilisation over your workstations , the same details can be used to help with licence management. Rob was clear to point out that Centrix isn’t a licence management product , but could certainly help make some decisions around the deployment of per-instance licensed software.
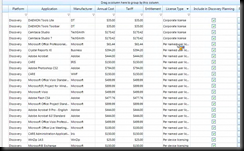
 

71b6ad0c-323d-4a9d-a2ef-ceee9e282e0a


With the main features of the product suitably demonstrated, we talked a little around the product itself. It is a regular 2 Tier application, running on windows with a Microsoft SQL Back-End. We didn’t have too much time to talk around the scaling of the product up to an enterprise space , but I’d like to see how it would cope with estates of over 40 or 50,000 workstations.

The agent itself is pretty streamlined – they have managed to get it down to a 500k install , which seems small enough in footprint , though I’d like to see what the footprint of an agent actively collecting would be on a workstations resources.

“Out of the box” – the product ships with 40 different reports on the raw data , to enable you to pull out the common detail with ease. While I don’t generally harp on too much about vnext features , the version 5 of the product due for launch early in the new year will feature a community reporting portal , hopefully along the lines of Thwack! the Portal from Solarwinds that enables Content exchange between users of the Orion products.

I think the product is quite niche & and sell of its features to budget holders isn’t necessarily around the technology / cost side of the product ( approx real cost of £20 / desktop )  but around the compliance / political side – Stakeholders have a tendency to object to user management via IT & and perceived “Big Brother” feeling that inventory / software metering agents tend to invoke with a user population.

I look forward to seeing how the product develops , with v5 proposed to go beyond analysis of thick client usage , into looking at how thin client application access via a browser are used. Matching this kind of data up with traditional monitoring data from the application backend would be most interesting.

In order to round off the post I made about attending this roundtable a couple of months ago, The Media wizards have polished up the video taken at the event. The more I see these videos , the more I can a) see the value in them and b) remind myself to stick to appearing on podcasts, I’m not very photogenic !


Starting off with the Q&A session – some pretty tough ones posed I felt.

Going a little bit back to front here , but this was Zanes main “pitch”


And finally yours truly at 0:28 🙂


The focus of the roundtable was very much around the Platform as a service offering from Microsoft – with recent announcements around office online ( Office 365 ) I look forward to see what Microsoft have got to say about Software as a Service.