Category: Automation


If there is one thing that all VMware monitoring solutions have in common , it is a connection to vCenter. The vCenter Web Service is a single point of contact between the outside world and the key performance API’s. What you do with that data once you have collected it varies from application to application , but they will all make that underlying connection to vCenter.


This puts vCenter into a bit of a special position within the infrastructure , namely a Single Point of Failure (SPoF)  As the ecosystem has grown up around vSphere , admins have become more and more reliant on vCenter – their backups depend on it , their monitoring depends on it and in some cases their orchestration layer depends on it. That’s a serious number of dependencies to have on a single box. Protecting vCenter from a hardware point of view is quite straightforward , just deploy it as a virtual machine. If you are going down the vCenter appliance route – this is your only choice.

Even if you do cover many of the bases when it comes to protection of the vCenter, there are still a few cases where you might loose it , e.g. storage corruption , back end database failure or even worse a catastrophic failure of the management cluster. When things are all going pear shaped , you still want someone to keep an eye on the business while you are fixing it.

This is where System Center really comes to the rescue – because it is an end to end monitoring framework , its going to be looking at the big picture , sometimes from the application stack downwards. The Health of the virtual infrastructure is simply a component of the picture. Letting the corporate central Operations Centre folk keep an eye on things while you concentrate on fixing the root cause of the outage is going to lead to a faster fix all round , with the subject matter experts doing what they do best !

However , if vCenter is down – how can we monitor the estate ? None of the tools will connect to a web service that isn’t there. With the Veeam Management Pack, we can make use of the Recovery Action feature and some PowerShell , in order to automate our own Veeam Virtualisation Extensions to go and talk directly to the hosts if they can’t talk to vCenter. Lets walk through an example.


image

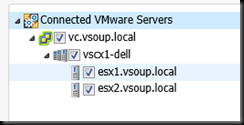
Here is my little test setup – I have a couple of vCenters , with a few hosts and VM’s underneath. I’m monitoring it in SCOM 2012 quite happily.

image

The Veeam Extensions service is merrily talking away to vCenter, bringing in events , metrics and topology information.

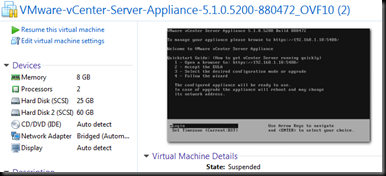
Merrily that is until ( fanfare : Dun dun Dah! ) disaster strikes, or in my case I suspend my vCenter appliance.

image


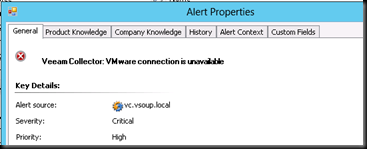
At this point with the standard version of the management pack, You would see the following alert & you would be left without vSphere level monitoring until you could bring vCenter back to life. No host hardware information , no datastore health.


image

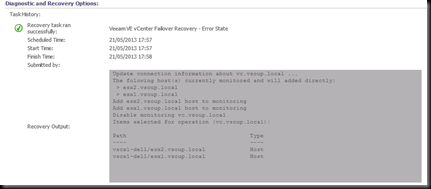
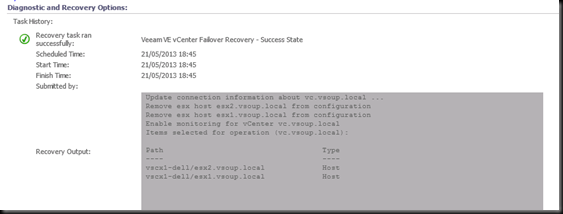
I have managed to persuade the R&D Wizards at Veeam to let me in on a very sneak preview of some upcoming functionality that should be appearing in the not to distant future. In the improved version , the alert above will trigger a Recovery Action . This action will run a PowerShell script to change connection points from the vCenter , to the hosts directly. SCOM has been configured with a credential profile for a root level account on each host.


image


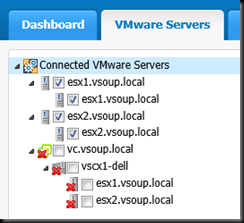
Once this script is complete , the VESS connection looks like this. The vCenter connection has been disabled (unchecked) – no harm in that, as it’s offline anyway. And direct-to-Host connections have been automatically created by the monitor Recovery Action, using our PowerShell interface.


image

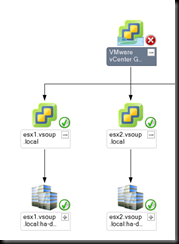
A short while afterwards , this change is reflected in the SCOM Topology.


image

note how we are looking at the hosts as individuals. Without  vCenter , there isn’t any vmotion so virtual machines will remain on the hosts they started when vCenter became unavailable. Monitoring teams can continue to keep an eye on the health of virtual machines and hosts for the duration of the outage.


image


Once vCenter is available again , the collectors run the recovery action in reverse in order to resume monitoring via vCenter.


image


Notice how the vCenter & datacenter names for the virtual machines have changed back.


image


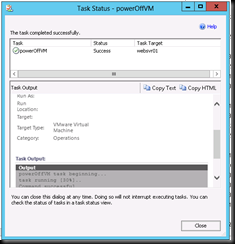
As an added bonus , we are able to execute tasks on underlying virtual machines even when vCenter is not available ( such as power on / power off ) – giving us the ability not only to look at the environment , but administer it , even when the centralised administration function is not available. Admins can control power states and manage snapshots without having to manually connect to each host in turn. The rest of the System Center suite has no dependency on vCenter either , The Veeam MP is able to drive data into System Center Orchestrator and System Center Service Manager to maintain host / vm CMDB.


image

By using Microsoft System Center Operations Manager 2012 , along with Powershell automation , we are enabling an Enterprise systems management team to continue to function during periods of vCenter outage. Keep watching for further releases and watch those SPoF’s !

Well the year is starting to wrap up – Twitter avatars look a little snowier and analysts are digging deep into their prediction boxes in the attic to see what 2012 is going to “be the year of <insert technology>”.


If you make no other resolutions in the coming 2 weeks or so , make this one , “I will attend a user group meeting” – for example the next London VMware User Group meeting is on the 26th of January, so its a nice early one to tick off the list. If you’d like to sign up for the meeting , head on over to here and sign up. If you feel you need a little more convincing on why a user group is for you, then read on.


7 Reasons why you should go to a usergroup

1. Its an educational event – Not only is there a chance to pick up some handy info from the sponsors and members presentations , for instance “how to build 1000 hosts in 10 minutes with VMware auto deploy” by Alan Renouf from VMware , or dabble in “A little orchestration after lunch" with Michael Poore – you could even brush up on those skills to complete a certification such as with Gregg Robertson’s VCP5 Tips & Tricks session.

2. Its a social event – a chance to meet with people who share similar sets of day to day issues as yourself , so its the perfect place to bounce an idea around with a peer group of very bright people

3. Its a fun event – from Alaric’s jokes at the welcome to the laughs and war stories at the pub afterwards its good humour all the way – just because we work in IT doesn’t mean that we’re socially crippled!

4. Its a free event! even lunch and a swift half at the pub later is covered

5. Its an interactive event – Its not just a day of PowerPoint overload , you can get involved with the hands on lab sessions , on this occasion sponsored by the guys over at Embotics, I’m sure you’ll have built a self service cloud portal before you can say “boo!”

6. Its a networking event – People pay quite a lot of money to marketing companies to be able to have “breakfast” with like minded peers for the purpose of networking – being in IT we’re much more practical , we’ll do it for free at the usergroup! Find out the gossip , who’s hiring & who wants to be hired. You might just find that next rockstar position you’ve been promising yourself!

7. Its a community driven event – think you can do better than the guy on stage ? got something worth saying ? well you have the opportunity to prove it at a user group – We love the sponsors, but what makes it a *user* group is the member driven content – it could be a panel / open roundtable or just an aspect of your day to day techie life that you think you’ve done well and would like to tell people about


Hopefully there is something that will strike a chord above – and I’ll see you on the 26th!

This is a blog post that I’ve had at the back of my mind for a good 6 months or so. The pieces of the puzzle have come together after the Gestalt IT Tech Field Day event in Boston. After spending the best part of a week with some very very clever virtualisation pro’s I think I’ve managed to marshal the ideas that have been trying to make the cerebral cortex to wordpress migration for some time !

Managing an environment , be it physical or virtual for capacity & performance requires tools that can provide you with a view along the timeline. Often the key difference between dedicated “capacity management” offerings and performance management tools is the very scale of that timeline.

clip_image002

Short Term : Performance & Availability

There we are looking at timings within a few seconds / minutes ( or less ) this is where a toolset is going to be focused for current performance on any particular metric , be it the response time to load a web application , Utilisation of a processor core or command operations rate on a disk array. The tools that are best placed to give us that information need to be capable of processing a large volume of data very quickly due to the requirement to pull in a given metric on a very frequent interval. The more frequently you can sample the data , the better quality output the tool can give. This can present a problem in large scale deployments due to a requirement that many tools have to write this data out to a table in a database – this potentially tethers the performance of a monitoring tool to the underlying storage available for that tools , which of course can be increased but sometimes at quite a significant cost. As a result you many want to scope the use of such tools only to the workloads that require that short term , high resolution monitoring. In a production environment with a known baseline workload , tools that use a dynamic threshold / profile for alerting on a metric can be very useful here ( for example Xangati or vCenter Operations ) If you don’t have a workload that can be suitably base lined ( and note that the baseline can vary on your business cycle , so may well take 12 months to establish ! ) then the dynamic thresholds are not of as much use.

Availability tools have less of a reliance on a high performance data layer as they are essentially storing a single bit of data on a given metric. This means the toolset can scale pretty well. The key part of availability monitoring is the visualisation and reporting layer. There is no point only displaying that data to a beautiful and elegant dashboard if no-one is there to see that dashboard ( and according to the Zen theory of network operations , would it change if there was no one there to watch it ! ) The data needs to be fed into a system that best allow an action to be made – even if it’s an SMS / Page to someone who is asleep. In this kind of case , having suitable thresholds are important – you don’t want to be setting fire alarms off for a blip in a system that does not affect the end service. Know the dependencies on the service and try to ensure that the root cause alert is the first one sent out. You do need to know that the router that affects 10,000 websites is out long before you have alerts for those individual websites.

Medium Term : Trending & Optimisation

Where the timeline goes beyond “what’s wrong now” , you can start to look at what’s going to go wrong soon. This is edge of the crystal ball stuff , where predictions are looking to be made in the order of days / weeks. Based on collected utilisation data in a given period , we can assess if we have sufficient capacity to be able to provide an acceptable service level in the near future. At this stage , adjustments can be made to the infrastructure in the form of resource balancing ( by storage or traditional load ) – tweaks can also be made to virtual machine configuration to “rightsize” an environment. By using these techniques it is possible to reclaim over allocated space and delay potential hardware expansions. This is especially valid where there may be a long lead time on a hardware order. The types of recommendations generated by the capacity optimisation components of VKernel , NetApp ( Akorri ) and Solarwinds products are great examples of rightsizing calculations.  As the environment scales up , not only are we looking for optimisations , but potential automated remediation ( within the bounds of a change controlled environment ) would save time and therefore money.

Long Term capacity analysis : When do we need to migrate Data centers ?

Trying to predict what is going to happen to an IT infrastructure in the long term is a little like trying to predict the weather in 5 years time , you know roughly what might happen but you don’t really know when. Taking a tangent away from the technology side of things , this is where the IT strategy comes in – knowing what applications are likely to come into the pipeline. Without this knowledge you can only guess how much capacity you will need in the long term. The process can be bidirectional though , with the information from a capacity management function being fed back into the wider picture for architectural strategy for example should a lack of physical space be discovered , this may combine with a strategy to refresh existing servers with blades. Larger Enterprises will often deploy dedicated capacity management software to do this ( for example Metron’s Athene product which will model capacity for not only the virtual but the physical environment )  Long term trending is a key part of a capacity management strategy but this will need to be blended with a solution to allow environmental modeling and what if scenarios. Within the virtual environment the scheduled modeling feature of VKernel’s vOperations Suite is possibly the best example of this that I’ve come across so far – all that is missing is an API to link to any particular enterprise architecture applications. When planning for growth not only must the growth of the application set be considered but the expansion in the management framework around it , including but not limited to backup and the short-medium term monitoring solutions.  Unless you are consuming your it infrastructure as a service , you will not be able to get away with a suite that only looks at the Virtual Piece of the puzzle – Power / Cooling & Available space need to be considered – look far enough into the future and you may want to look at some new premises !

We’re going to need a bigger house to fit the one pane of glass into…

“one pane of glass” – is a phrase I hear very often but not something I’ve really seen so far. Given the many facets of a management solution I have touched on above , that single pane of glass is going to need to display a lot ! So many metrics and visualisations to put together , you’d have a very cluttered single pane. Consolidating data from many systems into a mash-up portal is about the best that can occur , but yet there isn’t a single framework to date that can really tick all the boxes. Given the lack of a “savior” product you may feel disheartened , but have faith!. As the ecosystem begins to realise that no single vendor can give you everything and that an integrated management platform that can not only display consolidated data , but act as a databus to facilitate sharing between those discrete facets is very high on the enterprise wishlist , we may see something yet.

I’d like to leave you with some of the inspiration for this post – as seen on a recent “Demotivational Poster” –a quick reminder of perfection being in the eye of the beholder.

“No matter how good she looks, some other guy is sick and tired of putting up with her s***”


Never being a company to stagnate when it comes to releases , VKernel are continuing to develop their product set around capacity management and infrastructure optimisation for virtualised environments. After a strong quarter that has seen record numbers , expanded support for alternate Hypervisors such as Hyper-V & a new product aimed at the real time monitoring end of the capacity management spectrum ( vOPS Performance Analyzer )

The 3.5 release of the main VKernel vOperations Suite , to give it its full name is now “with added cloud”. I’m so glad the product marketing guys did NOT say that – in fact quite the opposite. The product had taken on features as suggested by its service provider & customers who are already down the path towards a private cloud.

vOPS 3.5 adds features which may make the life of an admin in such an environment easier – more often then not they are becoming the caretaker of an environment as workloads are generated via self service portals and on demand by applications. Being able to model different scenarios based on a real life workload is key to ensure your platform can meet its availability & performance SLA’s. Metrics in an environment mean nothing if you are unable to report on then, and this has been address with the implementation of a much improved reporting module within the product , which allows a much more granular permissions structure & the ability to export reports into other portals.

The capacity modeller component now allows “VM’s as a reservation” – knowing that not all workloads are equal means that you need to model the addition of workloads of differing size into an environment. These model VM’s can be based on a real CPU/MEM/IO workload.

The last key improvement is yet more metrics – this time around Datastore & VM performance including IOPS. Having been through an exercise where I had to manually collect IOPS data for an environment , I can personally attest to the value of automating this! When I was an end user of the vOPS product it was a metric I was constantly bugging the product development guys for – looks like they listened !


For more information, head over to the VKernel website.

I’ve been lucky enough in the last couple of days to get hands on with some Cisco UCS kit. Coming from a 99% HP environment , its been a very new experience. I’ll try to go get too bogged down into technical details , but wanted to note down what I liked and what I didn’t like about my initial ventures into UCS.


As ever with things like this, I didn’t spend weeks reading the manual. If I did that I’d do nothing but read manuals with no time to do any actual work Smile I did got through a few blog posts and guides by fellow bloggers who have covered UCS in much more detail than I will 9 at this stage at least.


It seems that the unique selling point of the UCS system is “server profiles” rather than setting up a given blade in a given slot , a profile is created and then either assigned to a specific server or allocated from a pool of servers. The profile contains a number of configuration items , such as number and config of NICs & HBA’s that a blade will have , and what order the server will try devices for boot.


The last item seems the most critical , because in order to turn our UCS blades into stateless bits of tin , I am building the server profiles to Boot-from-SAN. Specifically they will be booting up into ESXi , stored on a LUN of a Netapp FAS2020 storage unit. the Netapp kit was also a little on the new side to me so I’m looking forward to documenting my journey with that too!


Before heading deep into deploying multiple service profiles from a template, I thought I would start with some (relative) baby steps and create a single service profile , apply that profile to a blade and install ESXi onto an attached LUN , which I would then boot from. A colleague had predefined some MAC & WWN pools from me so I didn’t have to worry about what was going to happen with those.


Creating the service profile from scratch , using the expert mode ran me through a fairly lengthy wizard that allowed me to deploy a pair of vNIC’s and a pair of vHBA’s on the appropriate fabrics.A boot policy was also defined to enable boot form a virtual CDROM , followed by the SAN boot. At this point I found my first gotcha. It was a lot easier to give the vHBA’s a generic name , such as fc0 and fc1 rather than a device specific one e.g.. SRV01-HBA-A. Using the generic name would later allow me to use the same boot policy for all servers at a template level. As you also have to specify the WWPN for the SAN target, and at the time of writing the lab only had a single SAN , a single Set of WWPN’s can be put in. If you had requirements for different target WWPN’s you would need a number of boot policies.

Working our way back down the stack to the storage , the next task was to create the zone on the Nexus 5000 fabric switches. For cisco “old hands” here is a great video on how to do this via an SSH session.


Video thanks to : http://blogs.cisco.com/datacenter/the-san-boot-soon-will-be-making-another-lun/


I had just spent a bit of time getting a local install of fabric manager to run due to the local PostGres db. service account loosing rights to run as a service , which was nice Smile so determined to use fabric manager to define the zones. As with zoning on any system you need to persuade the HBA to log into the fabric. As a boot target had already been defined the blade will attempt to log into the fabric on startup , but it did mean powering it on and waiting for the SAN boot to fail. Once this was done the HBA’s can be assigned an alias , then dropped into a zone along with the WWPN of the storage and finally rolled up in to a zone set. Given that the UCS is supposed to be a unified system , this particular step seems to be a little bit clunky and would take me quite some time if I had 100 blades to configure. I will be interested to see if I can find a more elegant solution in the upcoming weeks.


Last but not least , I had to configure a disk. For this I used Netapp System Manager to create a lun and associated volume. I then added an initiator group containing the two HBA WWPN and presented the lun to that group. Again this seems like quite a lot of steps to be doing when provisioning a large number of hosts. Any orchestration system to make the this more expansive would have to be able to talk to UCS or the fabric to pull the WWPN’s from , provision the storage and present it accordingly.


The last step was to mount an iso to the blade , and install ESXi. This is the only step I’m not really pondering how I would do the install if it was not 1 but 100 hosts I had to deploy. I’d certainly look to PXE boot the servers and deploy ESXi with something like the EDA . By this stage I figured It was time to sit back with a cup of tea and ponder further about how to scale this out a bit. However when I rebooted the server post ESXi install , in stead of ESXi starting , I was dumped back to the “ no boot device found: hit any key “ message.


This was a bit of a setback as you can imagine , so I started to troubleshoot from the ground up. Has I zoned it correctly ? Did I present it correctly ? Had I got the boot policy correct ? I worked my way through every blog post and guide I could find but to no avail. I even attempted to create the service profile on the same blade , but again no joy. It would see the LUN to install from , but not to boot from.  As Charlie Sheen has shown , “when the going gets tough , the tough get tweeting” so reached out to the hive mind that is twitter. I had some great replies from @ChrisFendya and @Mike_Laverick who both suggested a hardware reset ( although mike suggested it in a non UCS way. The best way for me to achieve this was to “migrate” the service profile to another blade. This was really easy to do and one reboot later I was very relieved to see it had worked. It seems that sometimes UCS just doesn’t set the boot policy on the HBA, which is resolve by reassociating the profile.


I look forward to being able to deploy a few more hosts and making my UCS setup as agile as the marketing materials would suggest !

image

As a virtualisation professional , there seems an almost limitless choice of 3rd party software you can bolt into your environment. While VMware covers many of the bases with its own product lines in capacity planning , lifecycle management & reporting , some of them are missing a feature or two , or just too complex for your environment. Many vendors seek to address this problem with a multi product offering , but so far, I’ve only come across a single vendor who aim to address issues like these with a single product.

I spoke with Jason Cowie & Colin Jack from Embotics a few months ago , but was only able to secure a product demo last week – In some ways I wish I’d waited until the next release as it sounds like its going to be packed with some interesting features. I don’t really like blogging about what is “coming up in the next version” , so will be concentrating on what you can get today ( or in a couple of cases the minor release due any time ). This isn’t something specifically levelled at the Embotics guys who are most likely internally submersed in the “vnext” code so to them it is the current product.As an architect ,I’m just as guilty of evangelising about features of a product that is several months away form a deployment. Many vendors do the same to whip up interest around the product ( hyper-v R2 is a great example of this ) , but it doesn’t really show a level playing field to compare a roadmap item with an item that’s on the shelves today. When the 4.0 version of V-Commander is released , I look forward to seeing all of the mentioned features for myself !


So What is it ?

The Website really does define the V-Commander product as being all things to all men , that is to say if those men are into Virtualisation management ! They show how the Product can be used to help with : Capacity Management , Change Management , Chargeback and IT Costing , Configuration Management , Lifecycle Management , Performance Management and Self Service.

That’s a lot of strings to its bow – and certainly enough to make you wonder if its a jack of all trades, master of none type product. After a good look at the offering , I can safely say that’s not the case , but its defiantly stronger in some of those fields than others.

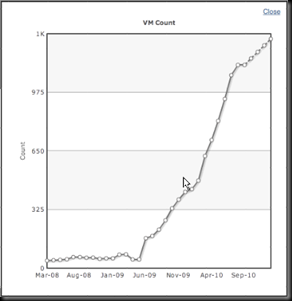
The “Secret Sauce” of the V-Commander product is its policy engine. Policies drive almost every facet of the product and they are what allows it to be as flexible as it is. Once connected to one or more vCenters , it will start gathering information right away. This is what they refer to as “0-Day Analysis” , For a large environment , the information gathering cycle for some capacity management products can take quite some time ( I’ve seen up to 36 Hours) as the appliance tries to pull some pretty granular information from vCenter. I wasn’t able to run the Embotics product against a large environment to see if this is the case.However, I have it from the Embotics guys  as an example, that to pull the information for 30 months of operation for a vCenter with 1200 machines took a couple of hours ;to me this is more than acceptable.The headline report that Embotics shows off as being a fast one to generate is one showing the number of deployed VM’s over time , which is a handy way of illustrating potential sprawl.

b195a201-e89d-467c-87c0-58a0c5cc1d71

The next key thing that V-Commander does is provide some more flexible metadata about a virtual machine. Entry of this data can be enforced by policy , for example you might want to say that all machines must have an end of use or set review date before they can be deployed. This really enforces the mantra of a cradle to grave lifecycle management application. The VM is tracked form its provision , through its working life and finally during the decommission phase. Virtual Machine templates can be tracked in the same way as Machines themselves – this sounds like an appealing way of ensuring you are not trying to deploy a machine from an old template. What is interesting is that the Metadata for an object can come in from other 3rd parties so there is potential to track Patching / Antivirus , so the appropriate integration be available.

f09cb019-7f5b-4171-ae39-588eaadc1429[6]

Policy enforcement is real time, so for example even if I attempted to power on a VM via an rCLI command that V-commander policies would not allow to be powered on , the product is fast enough to power it back off again before it left the BIOS. In addition to this an alert would be generated of the rogue activity.

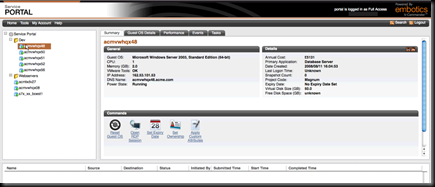
The Web GUI of the product splits into 2 main views – in addition to the administrators view There is also a “self service portal” – I put this in quotes for the very good reason that there are other self service portals that have currently hit the market which are more self provisioning. At this point on time the product does not provide self provisioning , but it is thought to be high priority for the 4.0 release. That the portal does allow is a very fine grained control that could be passed directly to VM owners without requiring any underlying access to vCenter , which is a feature that has some legs. They can currently request a machine , complete metadata and manage that specific groups of machines within an easy to use interface.

615836bf-1885-4629-a1eb-db8f42081340

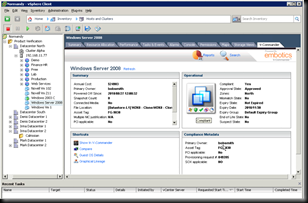
It is also possible to pull the data from V-Commander into the VI Client via a plugin to VI – this is defiantly aimed at the administrator rather than the VM Owner.

f8efb37d-9386-491c-be05-95be4a673b55


Automation is the key here and there are many issues where the product highlights that very well. While there is a degree of automation currently within the product , I think the next version will sink or swim on how well that ability is provisioned. For example , when it comes to Rightsizing a virtual machine , identifying those machines that may need a CPU adding or removing is great, being able to update the hardware on those machines automatically is what would actually get used , particularly in a large environment. Smaller shops may have a better “gut feeling” on their VM’s, hence will quite possibly manually tune the workloads more often. The product doesn’t have a whole lot in terms of analytics of virtual machine performance – the capacity management policies are pretty simple metrics at the moment, its certainly another area for potential growth to put that policy based automation engine to use.

V-Commander is slated to support Hyper-V in the 3.7 release , which is out any time now. I shall be interested to see how it will interact with the Self Service Portal in the upcoming versions of SC:VMM. From what I’ve seen of the product it could sit quite neatly behind the scenes of your <insert self service portal product here> and provide some of the policy based lifecycle management – all it would need would be a hook in from that front end so that those policies can be selected accordingly.

You get a lot of product for your money – which depending on how you want to spend it could cost you a fixed fee + maintenance , or an annual “rental” fee. I’ve been weighing up the pro’s and con’s of each licensing model and it would look like the subscription based model is the easier one to justify. It also means that should there be a significant change in the way you run your infrastructure , you wont be left holding licences that you’ve paid for , but can’t really use.


So is this the only Management software you’ll ever need ? At the moment, no it isn’t. That said its got some really strong features which aligned with a good service management strategy could help align your virtual infrastructure with the rest of your business.

Nb. I’ve just had some clarification on the release schedule for hyper-v support.

“Given priorities and customer feedback (lower
than expected adoption rates of Hyper-V), we decided to do only an internal release of Hyper-V (Alpha) with 3.7 (basic plumbing), with a GA version of Hyper-V coming in the first half of 2011.  At the beginning of 2011 we will begin working with early adopters
on beta testing.”

If you have a hyper-v environment and would like to take advantage of the embotics product , I’m sure they would be keen to hear from you.

No sooner than I was having a little bit of a moan about having to redeploy one of my lab hosts on ESX4.0 due to my trial of Kaviza 3.0 not supporting 4.1 , but I get notified of a version release.


In addition to the 4.1 support , the following features are added :

– Support for 64bit Windows 7 virtual desktops

– Support for linked clones with Citrix XenServer 5.6

– Support for CAC (Common Access cards) smartcards


Sadly I’m not actually able to test any of these apart from the first as I use nested ESXi – which does not support 64 bit guests 🙁 I’m also out of smartcard readers. What I did go through was the upgrade process , which while it was well documented by Kaviza would be a little bit fiddly in a large environment for those of you who shy away from a command line. I think they could take a leaf from vKernel’s book – they too started of with appliance based updates that required you to break out puTTY but now as long as the appliance has some form of internet access , the updater is built into the web GUI for the appliance. This is something I feel is quite important as when you are using an “appliance” , having to dive under the lid is a little bit undignified – especially if you are in the SMB space where time can be limited.

As well as an update to the appliance , the Kaviza agent that sits in each desktop also requires an update. this took me a couple of goes to get working , I suspect the reboot after agent removal wasn’t as clean as I’d have hoped , so the HDX install kept failing. An extra reboot set that back up. I wonder if there is a neater way for this to be done ?  I hope this isn’t the last you’ll see of the product from me , especially if I happen to win a full licence was part of Greg Stewart’s Giveaway on vDestination.com


http://vdestination.com/2010/09/21/win-your-own-personal-vdi-solution-from-kaviza/


and finally – I thought I’d see what I could get to talk to my Kaviza VDI in a box solution , so installed a Citrix Receiver on my aPad android based tablet. Its not quite as swish as an iPad – but it was a lot cheaper and certainly gives me ideas for the future !

Its been a busy weekend – not only have I been to a most excellent Chilli Festival but I’ve been migrating the backend storage for my 2 Veeam Proxies from a temporary LUN on our main IBM XIV over to a dedicated MSA p2000 . Its cost effective and will allow us to replicate the backup data offsite for some extra resiliency. Its taken me a while but now that I have plenty of storage , I wanted to be able to crank up the retention time for the backups from the current 14 days.


If you’ve read the previous posts about the setup I have , you’ll remember that its split into a fair number of jobs , which I didn’t particularly fancy having to mod via the GUI. I remembered that there was a Powershell plug-in for Veeam backup installed with the application , so thought I’d open up the help file and see if this could be scripted.


You’ll be glad to know it can. With the following command I was able to add an extra 5 days retention to all backup jobs on the server. I’ll keep an eye on the consumed storage by this and hopefully be able to up retention to a target of 30 days.


Get-VBRJob|Set-VBRJobOptions -RetainCycles 20

I’m the furthest thing from a  powershell guru that you’ll ever imagine , but can still string a 1 liner together when I have to 🙂

image

In a series of briefings from VKernel over the last few months we’ve seen upgrades to their core products , and a number of entry point free applications designed to give you taster of the power of the core products.

One of the points that I bought up every time I engaged with the vendor was that there was a fairly low level of integration between the products , and I felt that VKernel was really missing out by not blending these apps together , not only at the front end , but at the back end , as its clear there was a good level of duplication of data between them.

I’ve come to realise over the last 24 months that VKernel is pretty good at listening to its end users and the feed back I got was that an integrated platform was on its way. Wait no more , as its finally arrived.

Introducing the VKernel Capacity Management Suite 2.0

The Product is currently in private beta , but should be available to play with if you are lucky to get to go to VMworld in San Francisco – the rest of us will just have to hope for a beta invite pre GA , or Trial it on release. The CMS combines a number of the core VKernel product lines into a single appliance and claims to give improvements in 3 Keys areas , namely Scalability , Analytics & automation. The Suit integrates Capacity Analyser 5.0 , Optimization Pack 2.0 , Chargeback 2.0 and Inventory 2.0. The features are licensed individually and start at $299 per socket.

By combining the back end database requirements of the Capacity Analyser , & Optimisation Pack and Modeller ( due for roll into the CMS at a later date ) – the load on the vCenter API is considerably reduced. I’ve seem problems caused by too many requests to vCenter at once and will be glad to be able to reduce this where possible.

VKernel seem to have borrowed a page from Veeam’s business view homework and integrated an ability to create a more customised view of your environment , not just the vCenter hierarchy . Group can be organised by business unit , SLA or any particular way you define them. This is particularly handy where you implement a chargeback model as different groups may have different rates of chargeback. Previous incarnations of the VKernel products did allow this to happen , but the grouping were not shared between appliances , which made it a bit of a pointless exercise. With common grouping between each appliance that can contain VM’s from a number of vCenter instances , you are able to really see things through that mythical single pane of glass. The levels of capacity analysis can be varied between groups including implementing a custom vm model at each stage ( Data centre , Cluster , resource group or custom group )

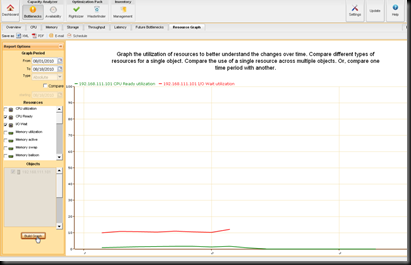
Any capacity management solution is only as good as its analytics and its where VKernel believe they are best in class within the Virtual World. with CMS 2.0 the VKernel have made some key improvements to the main analytics engine , this includes the use of storage throughput data in capacity calculations so that you are not longer just looking at CPU/ RAM / Drive Space when it comes to capacity calculation. Thin provisioning support is also provided, I personally haven’t seen the types of recommendation for this but would like to see recommendations on which VM’s can be safely thin provisioned due to a lo rate of drive space consumption. As previously mentioned , the “model” vm can be tweaked for different groups so you are not limited to a once size fits all recommendation for available capacity. You are also able to graph a number of VM parameters against each other so you can see what has changed over time and how its affected other parameters. An example of this is shown here.

image

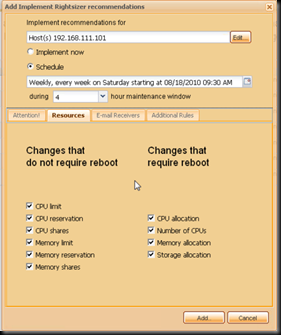
A feature missing from a number of other available solutions is the remediation side. Its all very well and good telling me where I should make the changes to a number of vm configurations , but in a large installation , its going to take me a long time to implement those recommendations. with CMS 2.0 its possible to remediate virtual machines based on the recommendations made ( some changes will require a virtual machine reboot, and these can be scheduled for off peak times ) The remediation screen will look something like below.

image

The notable exception to this is the “storage Allocation” option. I can see this being a tricky one , as it would involve shrinking of the guest drive , which might present a few issues on older windows guests. In the future perhaps an option could be implemented to migrate the VM to being thin provisioned ?

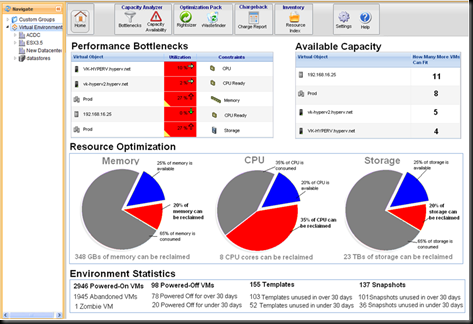
I was able to go through a live demo of a pre beta version of the product and the first thing you notice is the new Dashboard – a lot of work has gone into the redesigned UI and its a welcome improvement !

image

Users of the Optimization pack will find the layout quite familiar , with the Vm tree on the right hand side and the available appliances along the top. The The dashboard gives you a good at a glance view of the environment , before you start to drill down. What is a new features is being able to drill across – selecting a given branch of your environment , be it a traditional VI view or a custom grouping , then moving across the top icons you can click to view Capacity Bottle necks and available capacity , then move to the optimization features and see when in that branch you are not making the most effective use of your resources. As with previous versions of the product , any report you generate can be scheduled & emailed.

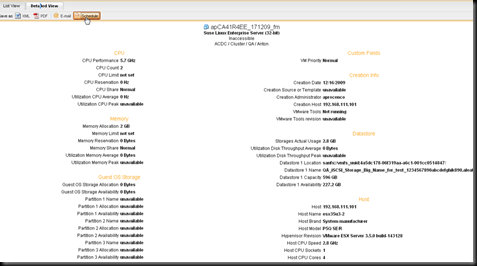
In some ways the unsung hero of the older versions of the optimization pack , the Inventory product has matured to a fully standalone offering. In use , its a great way to get detailed information on your virtual estate. Its essentially an indexed view of all of the virtual machines in your environment that you can organise , sort and export as you wish. In a previous life I used to use inventory to automatically mail summary list of VM’s by application to our financials teams to use in their static chargeback model as is gave a very easy way of showing total resource allocated to a VM ( including a sum of storage allocated ) . I’m sure you could find a number of extra uses – how about generating an XML export that your CMDB could pick up from ? In addition to the tabular information , its also possible to extract some pretty detailed information on a VM as shown below.

image

When CMS 2.0 is released – you’ll be able to grab a trial and see for your self. I’m looking forward to it 🙂

little foot note – speaking of rings , I proposed to my partner on Friday and am happy to report that she said yes ! 🙂

One of the great things about working in a large environment is the budget for tools to make your life easier , or run more smoothly. However this isn’t always the case – sometimes that budget gets pulled mysterious from under your feet ( and the Director gets a new Jag.. no connection 😉 )or sometimes its just not there. Nomatter what the size of your shop , there are still challenges which are not going to go away overnight. There is however a light at the end of the tunnel in the form of freeware tools , which I’ve blogged about on numerous occasions. My efforts in reporting these free tools are nothing compared with a fellow tweep @KendrickColeman who has put together pretty much the most comprehensive guide to what you can get for free to help you out.


Not a gent to rest on his laurels , he’s gone one better than that and put together a great bundle of these in an iso which really should make its way onto a datastore near you now.


First thinks first, get downloading the file – while thats happening , take a look at what awaits.

http://www.kendrickcoleman.com/images/documents/VM_Advanced.iso


The ISO is split into 6 folders , each covering an aspect of your day to day work.

1. P2V Cleanup

Always a fun thing to do but a few very handy little scripts & tools to make it nice and smooth. It’ll save me having to copy the HP PSP Cleaner to every box for a start.

2. Hal upgrade / Downgrade

Sometimes you have to do this as part of a post P2V operation or when you’ve finally caved into that application team naggin for the extra vCPU ( Man up and learn to say no next time , okay ! ) and then found out it makes no difference to the app performance , so have to downgrade the HAL again after removing the vCPU.

3. Partition Alignment

sadly Kendrick wasn’t able to include all the tools he wanted to on this ( while they are free , he wasn’t allowed to redistribute ) – but to get your Windows 2003 VM’s running as best as they can, you really want to work through a few of these.

4. Reclaim Space

Thin provisioning is a wonderful thing , but  all it takes is some bright spark to try and defrag the VM or copy a large file temporarily and the drive fills out quicker than my jeans on a trip to the US. Use Sdelete to zero out the deleted space and svmotion to thin the VM back out again.

5. Analysis

At some point in life , it will be necessary to do a little bit of benchmarking , be it on new storage or hardware. using iometer to generate comparative results of a VM’s performance pre & post aligning , or on a new datastore , or Loadstorm to stress test that new cluster should help you achieve that.

6. Sysprep files

Last but not least , these will save you the download for when you deploy a new vCenter and need to set up guest customisation.


If anyone would like to create a pretty front end menu for these – then get in contract with Kendrick – his mail address is in the post.


http://www.kendrickcoleman.com/index.php?/Tech-Blog/vm-advanced-iso-free-tools-for-advanced-tasks.html