Tag Archive: vkernel


This is a blog post that I’ve had at the back of my mind for a good 6 months or so. The pieces of the puzzle have come together after the Gestalt IT Tech Field Day event in Boston. After spending the best part of a week with some very very clever virtualisation pro’s I think I’ve managed to marshal the ideas that have been trying to make the cerebral cortex to wordpress migration for some time !

Managing an environment , be it physical or virtual for capacity & performance requires tools that can provide you with a view along the timeline. Often the key difference between dedicated “capacity management” offerings and performance management tools is the very scale of that timeline.

clip_image002

Short Term : Performance & Availability

There we are looking at timings within a few seconds / minutes ( or less ) this is where a toolset is going to be focused for current performance on any particular metric , be it the response time to load a web application , Utilisation of a processor core or command operations rate on a disk array. The tools that are best placed to give us that information need to be capable of processing a large volume of data very quickly due to the requirement to pull in a given metric on a very frequent interval. The more frequently you can sample the data , the better quality output the tool can give. This can present a problem in large scale deployments due to a requirement that many tools have to write this data out to a table in a database – this potentially tethers the performance of a monitoring tool to the underlying storage available for that tools , which of course can be increased but sometimes at quite a significant cost. As a result you many want to scope the use of such tools only to the workloads that require that short term , high resolution monitoring. In a production environment with a known baseline workload , tools that use a dynamic threshold / profile for alerting on a metric can be very useful here ( for example Xangati or vCenter Operations ) If you don’t have a workload that can be suitably base lined ( and note that the baseline can vary on your business cycle , so may well take 12 months to establish ! ) then the dynamic thresholds are not of as much use.

Availability tools have less of a reliance on a high performance data layer as they are essentially storing a single bit of data on a given metric. This means the toolset can scale pretty well. The key part of availability monitoring is the visualisation and reporting layer. There is no point only displaying that data to a beautiful and elegant dashboard if no-one is there to see that dashboard ( and according to the Zen theory of network operations , would it change if there was no one there to watch it ! ) The data needs to be fed into a system that best allow an action to be made – even if it’s an SMS / Page to someone who is asleep. In this kind of case , having suitable thresholds are important – you don’t want to be setting fire alarms off for a blip in a system that does not affect the end service. Know the dependencies on the service and try to ensure that the root cause alert is the first one sent out. You do need to know that the router that affects 10,000 websites is out long before you have alerts for those individual websites.

Medium Term : Trending & Optimisation

Where the timeline goes beyond “what’s wrong now” , you can start to look at what’s going to go wrong soon. This is edge of the crystal ball stuff , where predictions are looking to be made in the order of days / weeks. Based on collected utilisation data in a given period , we can assess if we have sufficient capacity to be able to provide an acceptable service level in the near future. At this stage , adjustments can be made to the infrastructure in the form of resource balancing ( by storage or traditional load ) – tweaks can also be made to virtual machine configuration to “rightsize” an environment. By using these techniques it is possible to reclaim over allocated space and delay potential hardware expansions. This is especially valid where there may be a long lead time on a hardware order. The types of recommendations generated by the capacity optimisation components of VKernel , NetApp ( Akorri ) and Solarwinds products are great examples of rightsizing calculations.  As the environment scales up , not only are we looking for optimisations , but potential automated remediation ( within the bounds of a change controlled environment ) would save time and therefore money.

Long Term capacity analysis : When do we need to migrate Data centers ?

Trying to predict what is going to happen to an IT infrastructure in the long term is a little like trying to predict the weather in 5 years time , you know roughly what might happen but you don’t really know when. Taking a tangent away from the technology side of things , this is where the IT strategy comes in – knowing what applications are likely to come into the pipeline. Without this knowledge you can only guess how much capacity you will need in the long term. The process can be bidirectional though , with the information from a capacity management function being fed back into the wider picture for architectural strategy for example should a lack of physical space be discovered , this may combine with a strategy to refresh existing servers with blades. Larger Enterprises will often deploy dedicated capacity management software to do this ( for example Metron’s Athene product which will model capacity for not only the virtual but the physical environment )  Long term trending is a key part of a capacity management strategy but this will need to be blended with a solution to allow environmental modeling and what if scenarios. Within the virtual environment the scheduled modeling feature of VKernel’s vOperations Suite is possibly the best example of this that I’ve come across so far – all that is missing is an API to link to any particular enterprise architecture applications. When planning for growth not only must the growth of the application set be considered but the expansion in the management framework around it , including but not limited to backup and the short-medium term monitoring solutions.  Unless you are consuming your it infrastructure as a service , you will not be able to get away with a suite that only looks at the Virtual Piece of the puzzle – Power / Cooling & Available space need to be considered – look far enough into the future and you may want to look at some new premises !

We’re going to need a bigger house to fit the one pane of glass into…

“one pane of glass” – is a phrase I hear very often but not something I’ve really seen so far. Given the many facets of a management solution I have touched on above , that single pane of glass is going to need to display a lot ! So many metrics and visualisations to put together , you’d have a very cluttered single pane. Consolidating data from many systems into a mash-up portal is about the best that can occur , but yet there isn’t a single framework to date that can really tick all the boxes. Given the lack of a “savior” product you may feel disheartened , but have faith!. As the ecosystem begins to realise that no single vendor can give you everything and that an integrated management platform that can not only display consolidated data , but act as a databus to facilitate sharing between those discrete facets is very high on the enterprise wishlist , we may see something yet.

I’d like to leave you with some of the inspiration for this post – as seen on a recent “Demotivational Poster” –a quick reminder of perfection being in the eye of the beholder.

“No matter how good she looks, some other guy is sick and tired of putting up with her s***”


Never being a company to stagnate when it comes to releases , VKernel are continuing to develop their product set around capacity management and infrastructure optimisation for virtualised environments. After a strong quarter that has seen record numbers , expanded support for alternate Hypervisors such as Hyper-V & a new product aimed at the real time monitoring end of the capacity management spectrum ( vOPS Performance Analyzer )

The 3.5 release of the main VKernel vOperations Suite , to give it its full name is now “with added cloud”. I’m so glad the product marketing guys did NOT say that – in fact quite the opposite. The product had taken on features as suggested by its service provider & customers who are already down the path towards a private cloud.

vOPS 3.5 adds features which may make the life of an admin in such an environment easier – more often then not they are becoming the caretaker of an environment as workloads are generated via self service portals and on demand by applications. Being able to model different scenarios based on a real life workload is key to ensure your platform can meet its availability & performance SLA’s. Metrics in an environment mean nothing if you are unable to report on then, and this has been address with the implementation of a much improved reporting module within the product , which allows a much more granular permissions structure & the ability to export reports into other portals.

The capacity modeller component now allows “VM’s as a reservation” – knowing that not all workloads are equal means that you need to model the addition of workloads of differing size into an environment. These model VM’s can be based on a real CPU/MEM/IO workload.

The last key improvement is yet more metrics – this time around Datastore & VM performance including IOPS. Having been through an exercise where I had to manually collect IOPS data for an environment , I can personally attest to the value of automating this! When I was an end user of the vOPS product it was a metric I was constantly bugging the product development guys for – looks like they listened !


For more information, head over to the VKernel website.

I’ve been lucky enough to be selected again to attend one of Gestalt IT’s Tech Field Day events. These place a selection of IT community members with a selection of Vendors for a series of sessions that go beyond the usual sales pitch you might get a user group event. The are also a lot more interactive , with a roundtable discussion before , after & sometimes during a session. The events are recorded and streamed live , you can also keep with with what the kids at the back of the class are whispering to each other by following the #TechFieldDay hashtag on twitter.


This Event is to be held in Boston in just over 2 weeks time and has a particular focus on Virtualisation technology. Other events have been based around Networking & Wireless technology, or just general datacenter technologies. The delegates have been selected for their work within the Virtualisation community , featuring more than its fair share of VMware vExperts and of course the whole vSoup Podcast crew! We are aiming to be able to record & publish an episode of the show live from the event.


The Presenters

Solarwinds :

I have seen Solarwinds present before and I’m looking forward to their deep dive style – as veteran TFD Sponsors they know that talking geeky is going to get a good response from us. I would imagine there will be some good detail on the product that is the fruit of the Hyper9 acquisition.

Vkernel:

I’ve enjoyed a good relationship with Vkernel over the last couple of years , both as an end user and as a blogger. Its not their first appearance at a Tech Field Day event so I’m sure that we’ll see something new around their infrastructure optimisation product set.

VMware:

I’ve heard good things about this little start-up , they have something called a Hypervisor , which could go far Smile Is what I’d have said man years ago , but like an ageing relative I’m going to have to say “look how they’ve grown!” I shall be looking forward to meeting up with the Wookie of Virtualisation , John Troyer and seeing what VMware have to show us beyond the press release!

Symantec:

Tech Field Day usually attracts a mix of sponsors , from the very fresh start-up ( in fact there will be a start-up coming out of “stealth mode” at the event ) to the established company. Symantec will sit firmly in the latter of those two and In my opinion have a harder task at these events because they have a PR/Marketing/Community machine that is more used to higher level , PowerPoint rich communication ; which is something that Tech Field Day just isn’t about. I’d love to see a “big” sponsor present with the passion and in depth knowledge of a start-up.

Embotics:

I was lucky enough to meet up with a few of the Embotics guys in the last year and while I like their policy based Virtualisation management product its been something that’s been quite a hard sell back to management. I’ve heard they might have something in the pipeline that will really emphasise its value. Watch this space for more details….


There is one extra vendor to be announced in addition to the “stealth mode” start-up launching itself , which I’m particularly looking forward to.  I think its going to be the perfect mixture of catching up with friends within the community , meeting some new ones and submersing myself in some seriously good technology. For more details, check out www.techfieldday.com


image

Yesterday, VKernel released a set of reports based on data they have been collecting via their free tools. Using data from over 500,000 Virtual Machines they’ve shown us some data we knew may well have been the case , but it nice to have it confirmed that "everyone else" is doing it as well.


You’ll have noticed in the EULA when you install Capacity View that you agree to send a little bit of data back to VKernel about your environment. Now this data is cleansed ( before being sent back ) but has been used as a basis of the report. I would be lying if I’d said this didn’t concern be at all , but I can think of a few people that might have had a bit of a 5p/10p moment knowingly sending data about what may be their production environment that they didn’t specifically opt-in to. It would be nice to be notified a little better – especially as we can now see that data isn’t being used for evil!

The Data from Hosts , VM’s , Clusters , Resource Pools , Storage ( both allocated & attached ) , Memory ( allocated & available), CPU ( allocated & available ) , Number of powered on / of VM’s , counts of Core / Socket & vCPU , indicators of VM’s with performance issues & underutilised VM’s.

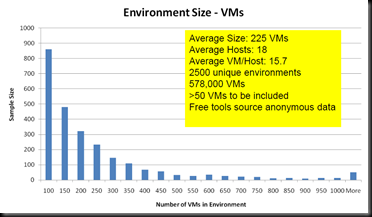
One of the nice summary graphs from the report just shows the size of environment.

image

Looking at the averages used , it would seem many of the environments seem to be hosting around the 225VM count. Now as the free system would only connect to a single VC at a time you could further qualify this as 225 VM’s per Virtual Center.

The "NATO Issue" Host has 2.4 sockets , and 3.6 cores per socket, each running at 2.6GHz. Its hooked up to about 1.8Tb of storage and has 50Gb of RAM. It enjoys long walks and would like to work with children….. got a bit side-tracked there 🙂 Of course looking at pure averages is nothing without looking at the distribution around it , but the numbers shown would seem to fit with a typical half height blade or 2u rackmount host.

We are still only fitting a mean of just over 2 vCPu / Core – a value that seems not to have changed over the years , however the increased core count has driven the VM/Host count up.


image


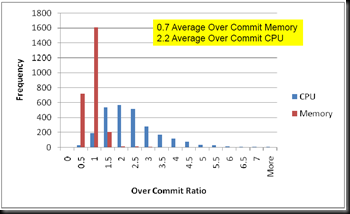
If you look at the blue bars in the able chart , representing the distribution of overcommit ratio, you’ll see that CPU Overcommit has quite a "long tail" , while the mean value of 2.2 is quite low , there are still a significant frequency of high vm/core deployments. These sites with a high consolidation ratio could well be for things like VDI , where the CPU overcommit ratio is often considerably higher.

Memory is a different story , though I’d like to perhaps look at it on a slightly different scale to see into the precise distribution. Many organisations are still not happy overcommitting memory and getting value out of technologies like transparent page sharing. this can be due to a number of reasons , e.g.. VM Cost model simplified around a premise of 0% overcommit or in some cases good old fashioned paranoia masked as conservatism. That said , looking at utilisation , RAM is the limiting resource for the majority of hosts , this is partially due to the very high costs of ultra density memory sticks ( there is currently not a linear price point going from 1-2-4-8-16GB sticks ) This may well change with some of the newer servers that simply have so many RAM slots that it is possible to push CPU back to the limiting resource , but personally I like having spare RAM slots on board. If I can hit the sweet spot on price / performance and still have space to expand, I’ll be a very happy camper.

I discussed this point with Bryan Semple from VKernel & it was his thought that by driving that number of VM’s / Host up that the cash saved on power & licensing would cover the higher cost of the memory. I’d love to hear what the JFVI readers think ?

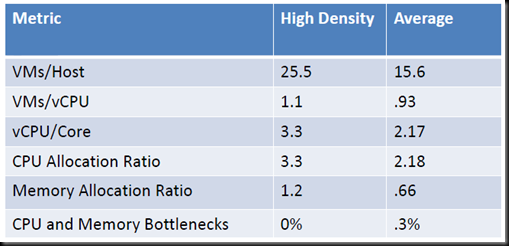
Bryan did a little bit of extra digging from the data and started to look at the high density environments that he had data for. Taking the total number of 2563 environments running over 50 Machines and looking for those that were overcommitting on both RAM & CPU without any indicated performance issues only left us with 95 environments, which seems a touch low , but again within my own environment I almost certainly have clusters that meet those criteria , but possibly not across the board. Within those "High Density Environments" the averages do go up by a fair bit. Leading to up to a 50% saving in costs per VM.


image

I think this is a great set of data to finish off the year with – Most of the data really cements those rules of thumb that so many VI admins tend to take for granted ( which came first , the rule of thumb or the data based on that rule though ? ). What will be even better is next year , assuming VKernel can collect an equally good set of data , and to see if we are able to change any of those key factors (  like VM’s per core ) up.


If you’d like to grab a copy of the VMI Report then its available here .

image


After the successful release of the Capacity Management suite product at VMworld , its all been pretty quiet on the VKernel front , which usually means they are up to something.In addition to coding away like the clever chaps they are , they’ve also been growing the company , always a handy thing to do if you’d like to put food on the table.Its been a bumper year and a record quarter for them with the key Metric of their client sizes continuing to grow, showing that people are taking the problem of optimisation planning & chargeback seriously. When I was invited onto a call with Bryan Semple , CMO for VKernel last week I was looking forward to something new. Little did I know that I’d actually seen a sneak peak of it back in July with the Chargeback 2.0 release.


One of the key features within the new versions of the chargeback product is that is supports chargeback for environments running on Microsoft’s Hyper-V platform , and specifically the support for the Virtual Machine Manager Self Service Portal Toolkit (MSVMMSSP) . This allow the creation of self service portals to not only provision Machines according to a quote , but to be able to collect metrics for static or utilisation based chargeback of those machines. This starts to become increasingly relevant as enterprises move towards a “cloud” model ( presumably private with hyper-v at the moment ) VKernel has been selected as the primary chargeback vendor. Other partners providing support for the toolkit include IBM , Dell , EMC NetApp and HP


Ok so I almost went two paragraphs without using the “C” word – I could have been a lot worse! When looking at the kind of product that VKernel offers from a cloud provider perspective , the importance of the 3 sub products ( Capacity Analysis , Optimisation & Chargeback ) gets juggled around a bit. A service provider doesn’t really care as much about VM rightsizing as the end users are going to pay for it. A public cloud is also going to be looking at capacity from a slightly different point of view so while its important , I would imagine they may well use a different toolset.


VKernel has integrated with Microsoft’s “cloud” product , but what will it do with VMware other than the existing integrations , I would suspect they are keeping a very careful eye on the vCloud Director API and how they can best plug into that for example to track the costs of a vApp in a hybrid cloud situation as it moves from the private to public datacenter.

image

In a series of briefings from VKernel over the last few months we’ve seen upgrades to their core products , and a number of entry point free applications designed to give you taster of the power of the core products.

One of the points that I bought up every time I engaged with the vendor was that there was a fairly low level of integration between the products , and I felt that VKernel was really missing out by not blending these apps together , not only at the front end , but at the back end , as its clear there was a good level of duplication of data between them.

I’ve come to realise over the last 24 months that VKernel is pretty good at listening to its end users and the feed back I got was that an integrated platform was on its way. Wait no more , as its finally arrived.

Introducing the VKernel Capacity Management Suite 2.0

The Product is currently in private beta , but should be available to play with if you are lucky to get to go to VMworld in San Francisco – the rest of us will just have to hope for a beta invite pre GA , or Trial it on release. The CMS combines a number of the core VKernel product lines into a single appliance and claims to give improvements in 3 Keys areas , namely Scalability , Analytics & automation. The Suit integrates Capacity Analyser 5.0 , Optimization Pack 2.0 , Chargeback 2.0 and Inventory 2.0. The features are licensed individually and start at $299 per socket.

By combining the back end database requirements of the Capacity Analyser , & Optimisation Pack and Modeller ( due for roll into the CMS at a later date ) – the load on the vCenter API is considerably reduced. I’ve seem problems caused by too many requests to vCenter at once and will be glad to be able to reduce this where possible.

VKernel seem to have borrowed a page from Veeam’s business view homework and integrated an ability to create a more customised view of your environment , not just the vCenter hierarchy . Group can be organised by business unit , SLA or any particular way you define them. This is particularly handy where you implement a chargeback model as different groups may have different rates of chargeback. Previous incarnations of the VKernel products did allow this to happen , but the grouping were not shared between appliances , which made it a bit of a pointless exercise. With common grouping between each appliance that can contain VM’s from a number of vCenter instances , you are able to really see things through that mythical single pane of glass. The levels of capacity analysis can be varied between groups including implementing a custom vm model at each stage ( Data centre , Cluster , resource group or custom group )

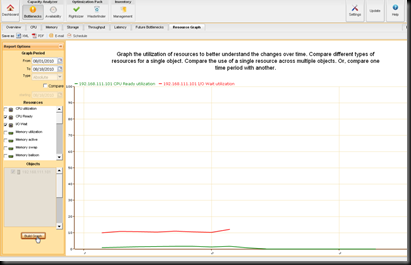
Any capacity management solution is only as good as its analytics and its where VKernel believe they are best in class within the Virtual World. with CMS 2.0 the VKernel have made some key improvements to the main analytics engine , this includes the use of storage throughput data in capacity calculations so that you are not longer just looking at CPU/ RAM / Drive Space when it comes to capacity calculation. Thin provisioning support is also provided, I personally haven’t seen the types of recommendation for this but would like to see recommendations on which VM’s can be safely thin provisioned due to a lo rate of drive space consumption. As previously mentioned , the “model” vm can be tweaked for different groups so you are not limited to a once size fits all recommendation for available capacity. You are also able to graph a number of VM parameters against each other so you can see what has changed over time and how its affected other parameters. An example of this is shown here.

image

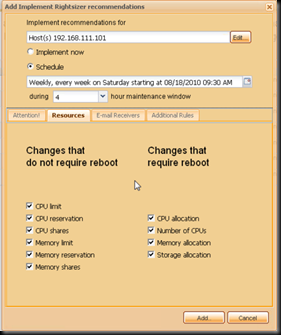
A feature missing from a number of other available solutions is the remediation side. Its all very well and good telling me where I should make the changes to a number of vm configurations , but in a large installation , its going to take me a long time to implement those recommendations. with CMS 2.0 its possible to remediate virtual machines based on the recommendations made ( some changes will require a virtual machine reboot, and these can be scheduled for off peak times ) The remediation screen will look something like below.

image

The notable exception to this is the “storage Allocation” option. I can see this being a tricky one , as it would involve shrinking of the guest drive , which might present a few issues on older windows guests. In the future perhaps an option could be implemented to migrate the VM to being thin provisioned ?

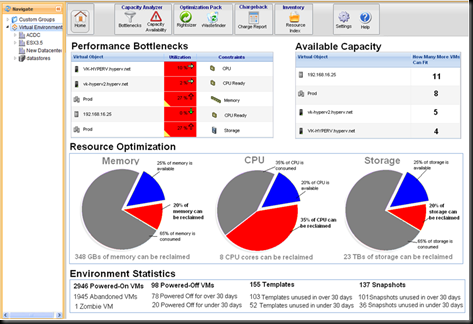
I was able to go through a live demo of a pre beta version of the product and the first thing you notice is the new Dashboard – a lot of work has gone into the redesigned UI and its a welcome improvement !

image

Users of the Optimization pack will find the layout quite familiar , with the Vm tree on the right hand side and the available appliances along the top. The The dashboard gives you a good at a glance view of the environment , before you start to drill down. What is a new features is being able to drill across – selecting a given branch of your environment , be it a traditional VI view or a custom grouping , then moving across the top icons you can click to view Capacity Bottle necks and available capacity , then move to the optimization features and see when in that branch you are not making the most effective use of your resources. As with previous versions of the product , any report you generate can be scheduled & emailed.

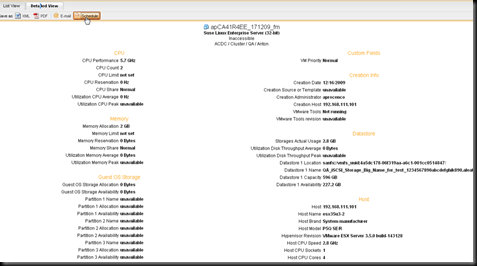
In some ways the unsung hero of the older versions of the optimization pack , the Inventory product has matured to a fully standalone offering. In use , its a great way to get detailed information on your virtual estate. Its essentially an indexed view of all of the virtual machines in your environment that you can organise , sort and export as you wish. In a previous life I used to use inventory to automatically mail summary list of VM’s by application to our financials teams to use in their static chargeback model as is gave a very easy way of showing total resource allocated to a VM ( including a sum of storage allocated ) . I’m sure you could find a number of extra uses – how about generating an XML export that your CMDB could pick up from ? In addition to the tabular information , its also possible to extract some pretty detailed information on a VM as shown below.

image

When CMS 2.0 is released – you’ll be able to grab a trial and see for your self. I’m looking forward to it 🙂

little foot note – speaking of rings , I proposed to my partner on Friday and am happy to report that she said yes ! 🙂

I was fortunate enough to have the opportunity of a face to face meeting with Doug this week, He happened to be passing through the UK on the return leg of his travels to see amongst others , the development team in Moscow.

While vendor meetings are a reasonably frequent part of my worklife , they are not usually with the CEO , but its clear that then it comes to Vkernel they all share the same vision of flag ship product offering the best in class for Capacity Analysis.

After a brief bio.. (He’s only a recent addition to the Vkernel team , but as former CEO of Onaro and experience at Motive & Tivoli , he no stranger to the arena ) We talked about how Vkernel got where it is , and what the current offerings are, both free and licensed.

Then we got to the interesting stuff – where Vkernel is going. One of the things I’ve always fed back not only as a blogger but as an end user is a call for tighter integration between the product lines. In a world where de-duplication is very much a buzzword , there is plenty of scope within the product range for integration not only at the front end in terms of user interface , but at the back end datasets. The next release major release ( as yet unnamed ) from Vkernel will seek to address that and move all of the task under that single pane of glass in a single appliance with a single database. I know this has been in the pipeline for some time and I’m looking forward to getting my hands on it. The other main feature Doug hinted towards was about getting data out of the products. While they have their own transports for pulling data out ( scheduled reports in  pdf or xml) there currently isn’t any way that this could be done programmatically – who knows what form this API could take but it any way of exposing the results of the analysis to the rest of the environment has got to be “a good thing”

Moving away from the technical to the strategic side we briefly touched on some of current news of VMware targeting its own partners and releasing a competing product in many sectors of the management eco system. Far from reducing revenue , Doug believes the reverse has occurred as awareness of the need for capacity management is raised people are more likely to “bake off” a number of products from all the main vendors and choose the one they like best. Looking to the future we spoke around the idea of more intelligent modelling using metrics derived from what a given environment can provide, to give an accurate benchmark of the typical VM. This has a high value at the Architecture stage of a project , where you can clearly see if your environment meets the requirements of the vendor , not only in CPU/ Ram count , but network and IO performance.

Watch this space for more news on upcoming releases from Vkernel.

It seems barely a paycheck goes by without a new release from VKernel , which of course is a great thing, no one wants a software company to stand still , and there is certainly no moss on their rolling stone !

The latest release is an update to one of their existing products – Chargeback. This was actually the first main release by the firm a couple of years back and in some respects was a little ahead of its time , addressing a challenge that many end users wouldn’t have hit yet.

Chargeback is a core piece of the puzzle for any self respecting cloud provider , but before “the cloud” was quite such a buzz it was probably the last things many shops were thinking about – Initial infrastructure design and persuading the business to virtualize production workloads were much higher up the agenda.

Speaking on my own experience of chargeback , it was quite a struggle to come up with an initial model that would ensure that the costs incurred in building out a virtual infrastructure for our application teams were suitably recovered, so we ended up with a much more static model of a fixed cost per vm/ per month.

VKernel has recognised some of these challenges and has shifted the core focus of the product from chargeback to “showback” – rather than being used as a tool to directly bill end users , it can be very effective at showing what they would have been charged at an external service provider for example.

Chargeback costs can be shown in one of 2 keys ways – allocated & measured. If a team has the view of they want to be able to use all their allocated resources and not worry about a variable cost each month then an allocated cost model is appropriate. Should they wish costs to be allocated on a more pay as you go basis , then measured costs can be shown. Both figures could be shown on a report to give end users an idea of over allocation – e.g.. You have been billed $100 for this VM in this charging period , but only actually used $30 of resources. This kind of figure could help drive a shift towards a fully measured model for virtual machine cost recovery within a private cloud.

Virtual machines can be grouped into applications / custom groups , which can then be allocated a cost centre. Each group can have its own rate for chargeback to reflect perhaps a lower tiered storage or denser overcommitted model in a non-production environment.. What would be nice is for those custom groups to be carried across into the other VKernel core products to be able to generate optimisation / capacity planning reports for that same group of applications. Brian Semple , CMO for VKernel has assured me this is a feature they like the sound of too – watch this space for further details. Reports can be automated and mailed to the relevant users in a variety of formats from Excel to Acrobat.

The biggest change with the 2.0 product is that it is no longer restricted to collecting reports from a VMWare environment. VKernel has been selected by Microsoft as a Key Chargeback Provider for the System Center Virtual Machine Manager Self Service Portal ( easily shortened to SCVMMSSP 😉 )  Key Metrics from the Microsoft System center products – Operations Manager and Virtual Machine Manager can be pulled into the Chargeback appliance to generate the same level of reports and to integrate that functionality into the Self Provisioning portal built into SCVMM.

From a strategic point of view this does extend the relationship between VKernel and Microsoft and I suspect as time goes on we’ll see cross hypervisor support for more and more of the VKernel product line – Particularly as VKernel and VMware seem to be clashing horns a little. What I find interesting is does this represent a shift from Microsoft into integrating a virtual appliance based solution to management ? I’ll do a little bit of digging and follow up if possible. Personally I see the use of the virtual appliance as more of a function of the underlying development structure. VKernel’s dev team clearly specialises in the Java route , which as we know works great in a VMware based environment. By contrast Veeam rely on Microsoft .NET code in their products which I’d have thought would have potentially been a better fit from the Microsoft point of view.

I tried to avoid a “me too!” post on today’s vSphere 4.1 release , but afraid I failed miserably. I’m not going to cover a full set of updated features as there are many many of my fellow bloggers who have done a very fine job of that, and to emulate them would be a little watered down as I’ve yet to have much time to play with it. If you have been hiding under a rock for the last 24 hours or so , then head on over to http://vsphere-land.com/ and click away to your heart’s content!


One of the aspects that caught my eye however was the announcement of a new licensing model for some of the vSphere Management products.

from : the official press release 

“VMware vCenter AppSpeed, VMware vCenter Chargeback, and VMware vCenter Site Recovery Manager will be sold in VM packs on a per VM basis starting on September 1, 2010. VMware vCenter Application Discovery Manager and VMware vCenter Configuration Manager are already licensed on both a per VM and physical server model. Per VM licensing for VMware vCenter CapacityIQ will take effect in the fourth quarter of 2010.”

This new model supersedes the existing per processor model in place for AppSpeed , Chargeback and SRM products that you can still purchase today. VMware suggests that this will enable customers to move to a more cloud like model for their virtual estate ( as far as the “side dish” products go , this announcement does not cover the core product … yet )

It got me thinking about possible scenarios , along with a couple of comments made by the community on twitter , that it seems possibly a little counter productive. However , playing my own Devils Advocate , I can also think of situations where it would be advantageous.

Currently SRM is licensed per CPU on the Hosts you want to run protected VM’s on. Lets take a hypothetical enterprise. They have a primary Datacenter , running vSphere across 10 hosts. In order to drive utilisation/consolidation ,these hosts host a mixed lifecycle of machines , some production (say,50% ) , some non production hence not really considered important enough to require automated recovery.

A smaller VI estate is provisioned at the secondary site , to host those production VM’s are part of an SRM Install. However as the production VM’s are spread over 10 hosts , they end up buying 40 SRM licenses ( lets assume they are running quad socket hosts )

Due to growth or political reasons , they decide to separate out their life cycles and move the non production VM’s onto a different environment , possibly even running a lower cost hypervisor. No further SRM licences required of course.

The business grows and due to all the spare capacity on the production cluster , they are able to double the number of VM’s on that cluster and really push for a high consolidation ratio. All without having to purchase any further hypervisor licences (or OS licences , if they where clever and purchased Windows Data centre edition licences for the hosts )

Under the new cost model , they will have to go through an audit of VM count to cover the increased average growth in production VM’s ( VMware’s graph showed VM numbers going up and down quite quickly , but in my experience in a production environment , once a server is commissioned for production , it tends to stay there unless there is a very good reason to decommission it )  This may well be balanced out by the lower initial cost but that’s down to the consolidation ratio on those production hosts. The new model would seem to favour a lower consolidation ratio for your hosts , possibly diluting all those cost savings you told your management about that would come from a highly consolidated environment!

If you can pick and choose which guests you would like to cover with these “side dish” products , then the model does enable clusters which cross lifecycles as you may not need the full functionality for every guest , but it does require careful licence management – wasn’t Virtualisation supposed to reduce management overheads like this ?

I can however see some benefit on the financials , especially where organisations have made those steps towards a cloud model as the licence is easier to roll into the setup charge / periodic charge for a VM rather than having to commit to the capex for the licence cost for the whole cluster before you have got any money back from chargeback.

If this is the future for VMware’s licensing across the board , is it going to lead to “host sprawl” as new hosts are popped up with lower spec or possibly reuse/extended lifetime of old machines – a bit of a plus point when it comes to not requiring disposal , but not when you have to power and cool legacy kit which may be less efficient than the hosts at the top of your list. More hosts also means more patching and even with the best automation models in place it’ll still end up causing more work. Financially stretched clients might decide to scale applications up rather than out due to increased licence costs – before we know it , we’re back to 4 years ago with a large number of servers running consolidated services on them.

Time will tell , but in the mean time I think I’ll continue to support ecosystem partners such as Veeam & vKernel – I like my all you can eat buffet 🙂


thanks to @rootwyn & @kendrickcoleman for the feedback & sanity check !

On Monday , I blogged about the new freeware application from vKernel, StorageView –.I , like a number of other bloggers had got a chance to see the product pre release, and was able to download the application to evaluate before its public release.

I have to admit I was having a pretty full timetable , so don’t feel I gave the post my full attention , beyond an install and a brief glance to see what it was like, I had other fires to fight and my day job took precedence ( as it should ! )

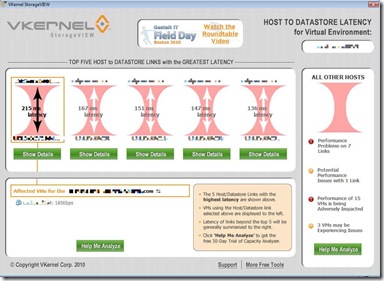
Yesterday ,I was talking with some of the vkernel product team who wanted to verify that the product not only works in small scale environments but larger ones. As I have access to a reasonably large environment I was able to install a slightly updated version and test , I’m quite glad of this as it actually gave me some time to really study the figures and see what was happening to my environment , rather than a test lab. What I got was shown below.

storageview2

Even through the pixilation I’ve applied you might be able to see that 4 of the top 5 offenders are on the same host – I happen to know that host is in a prod 3.5 cluster that has recently been part of a fabric upgrade. ON closer investigation I discovered that one of the HBA’s was not seeing its full compliment of paths , most likely due to it not picking up the change in fabric.One HBA rescan later and paths have been restored and latency significantly reduced. There’s something still not quite right however but that’s for a trip to the datacenter armed with a pack of fibre interconnects and a frying pan to batter whoever might have caused some cable damage 😉


(please note no datacenter technicians have been harmed during the writing of this post…….yet )