Yesterday, VKernel released a set of reports based on data they have been collecting via their free tools. Using data from over 500,000 Virtual Machines they’ve shown us some data we knew may well have been the case , but it nice to have it confirmed that "everyone else" is doing it as well.
You’ll have noticed in the EULA when you install Capacity View that you agree to send a little bit of data back to VKernel about your environment. Now this data is cleansed ( before being sent back ) but has been used as a basis of the report. I would be lying if I’d said this didn’t concern be at all , but I can think of a few people that might have had a bit of a 5p/10p moment knowingly sending data about what may be their production environment that they didn’t specifically opt-in to. It would be nice to be notified a little better – especially as we can now see that data isn’t being used for evil!
The Data from Hosts , VM’s , Clusters , Resource Pools , Storage ( both allocated & attached ) , Memory ( allocated & available), CPU ( allocated & available ) , Number of powered on / of VM’s , counts of Core / Socket & vCPU , indicators of VM’s with performance issues & underutilised VM’s.
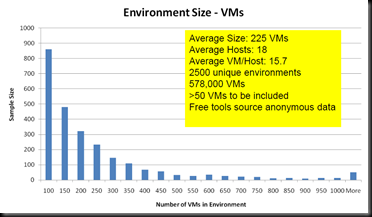
One of the nice summary graphs from the report just shows the size of environment.
Looking at the averages used , it would seem many of the environments seem to be hosting around the 225VM count. Now as the free system would only connect to a single VC at a time you could further qualify this as 225 VM’s per Virtual Center.
The "NATO Issue" Host has 2.4 sockets , and 3.6 cores per socket, each running at 2.6GHz. Its hooked up to about 1.8Tb of storage and has 50Gb of RAM. It enjoys long walks and would like to work with children….. got a bit side-tracked there 🙂 Of course looking at pure averages is nothing without looking at the distribution around it , but the numbers shown would seem to fit with a typical half height blade or 2u rackmount host.
We are still only fitting a mean of just over 2 vCPu / Core – a value that seems not to have changed over the years , however the increased core count has driven the VM/Host count up.
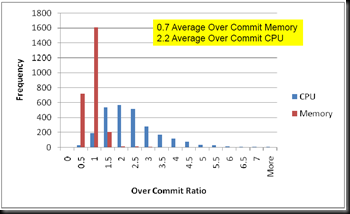
If you look at the blue bars in the able chart , representing the distribution of overcommit ratio, you’ll see that CPU Overcommit has quite a "long tail" , while the mean value of 2.2 is quite low , there are still a significant frequency of high vm/core deployments. These sites with a high consolidation ratio could well be for things like VDI , where the CPU overcommit ratio is often considerably higher.
Memory is a different story , though I’d like to perhaps look at it on a slightly different scale to see into the precise distribution. Many organisations are still not happy overcommitting memory and getting value out of technologies like transparent page sharing. this can be due to a number of reasons , e.g.. VM Cost model simplified around a premise of 0% overcommit or in some cases good old fashioned paranoia masked as conservatism. That said , looking at utilisation , RAM is the limiting resource for the majority of hosts , this is partially due to the very high costs of ultra density memory sticks ( there is currently not a linear price point going from 1-2-4-8-16GB sticks ) This may well change with some of the newer servers that simply have so many RAM slots that it is possible to push CPU back to the limiting resource , but personally I like having spare RAM slots on board. If I can hit the sweet spot on price / performance and still have space to expand, I’ll be a very happy camper.
I discussed this point with Bryan Semple from VKernel & it was his thought that by driving that number of VM’s / Host up that the cash saved on power & licensing would cover the higher cost of the memory. I’d love to hear what the JFVI readers think ?
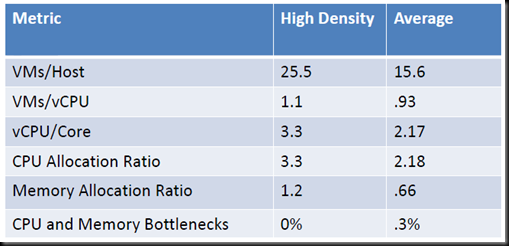
Bryan did a little bit of extra digging from the data and started to look at the high density environments that he had data for. Taking the total number of 2563 environments running over 50 Machines and looking for those that were overcommitting on both RAM & CPU without any indicated performance issues only left us with 95 environments, which seems a touch low , but again within my own environment I almost certainly have clusters that meet those criteria , but possibly not across the board. Within those "High Density Environments" the averages do go up by a fair bit. Leading to up to a 50% saving in costs per VM.
I think this is a great set of data to finish off the year with – Most of the data really cements those rules of thumb that so many VI admins tend to take for granted ( which came first , the rule of thumb or the data based on that rule though ? ). What will be even better is next year , assuming VKernel can collect an equally good set of data , and to see if we are able to change any of those key factors ( like VM’s per core ) up.
If you’d like to grab a copy of the VMI Report then its available here .
« Environment mapping made Easy with Centrix Software What was 2010 for JFVI ? »


 LinkedIn
 Twitter
While I agree that the data and statistics are interesting in and of itself, the fact that VKernel gathers this data from potentially unknowing “customers” is very bad form.
Even if it is mentioned in the EULA, and everyone really should read those, not having an opt-in policy for data gathering is very, very bad and could potentially be a PR nightmare for VKernel.
Let this be a lesson to all you kids out there, read your EULAs. They are boring, tedious and at times even ridiculous, but their content might just be what pushes a vendor out your door never to be let in again.
It is not brilliant form – and I agree with you , its incidents like this that can cause some real strain with internal security teams.
[…] This post was mentioned on Twitter by Christian Mohn and Chris Dearden, Chris Dearden. Chris Dearden said: new on JFVI: http://tinyurl.com/2wz2bpy – VKernel releases the Virtualisation Management Index […]
Only just saw this, thanks for the post Chris. While hardly scientific it’s useful to have some ‘industry’ figures like this – it gives me some metrics to argue against our our low consolidation ratio. Why our ratio is low is another post altogether but no-one likes to be lagging the majority without good cause!